GOM Revenue Sharing-2: GOMESA Phase II revenues impacted by several factors
Mark J Kaiser
Center for Energy Studies
Louisiana State University
Baton Rouge
The first phase of the 2006 Gulf of Mexico Energy Security Act (GOMESA) regulated revenue sharing in the gulf's 181 Area and 181 South Area. Its scope is small in relation to the program's second phase, which covers activity from 2017-57 in the eastern, western, and central GOM planning areas.
The expanded geographic coverage and time frame of Phase II means more qualified revenue generation and a more complex revenue-sharing model.
The first article of this three-part series looked at the GOM outer continental shelf (OCS) leasing process (OGJ, Mar. 2, 2015). This second article examines the components of GOMSEA Phase II revenue to gauge their capacity for generating cash flow. Next month's concluding article will forecast GOMESA Phase II revenue streams.
Phase II revenues derive from bonus bids and rent on awarded leases, as well as royalties on producing leases from multiple inventories over different time periods.
To make the relationships between these components clearer, we present an historical analysis and employ simple factor models to determine the sources and impacts of revenue generation.
Lease sales
The first federal offshore lease sale was held in 1954 under the provisions of the Outer Continental Shelf Lands Act (OCSLA) of 1953. The process has remained mostly unchanged since.
Acreage is available to the market at a specific date and players offer a cash bonus in a sealed bid for desired leases. The high bidder wins, subject to a fair market review, and gets the right to develop and produce any oil and gas discovered on the leases.
Production is subject to a specified royalty and the term of the lease without production depends on the water depth and lease sale.
Before 1982, leases nominated by companies were offered to the market. After 1982, area-wide leasing, which makes available all leases that are not active or subject to moratoriums, was introduced.
Section 1344 of OCSLA requires the US Department of the Interior to maintain a 5-year leasing program which reflects consideration of economic, social, and environmental values, satisfies the US National Environmental Policy Act, and considers the inputs of federal agencies, the governors of affected states, and programs developed under the US Coastal Zone Management Act.
The leases awarded during the 5-year plans of 2007-12 and 2012-17 and their incremental contribution to OCS revenue, along with the future leases that will be awarded in the 5-year sales through 2057, determine GOMESA Phase II qualified revenues.
The annual sum of high bids on leases awarded represents the bonus bid revenue. After acreage is awarded, it enters its primary term. Rent is an annual payment required to maintain the lease during the primary term and is paid until the lease produces, expires, or is relinquished.
If by the end of the primary term no development has occurred, the lease reverts back to the government and is offered to the market in a future lease sale.
Bonus bids
Once production starts, rentals cease and royalties commence during the secondary term and continue as long as the lease is producing in paying quantities. Royalty is paid on the gross value of production less the cost of allowed transportation and processing fees.
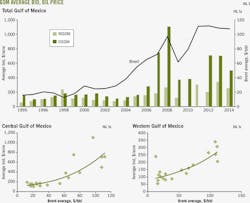
The annual sum of high bids has varied widely over the past 2 decades, from a low of $250 million in 1999, to more than $4 billion in 2008 (Fig. 1).
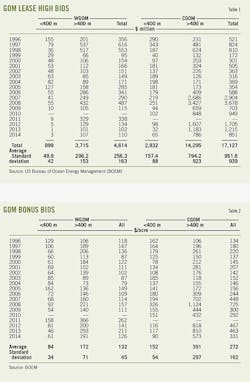
In 2014, high bids from lease sales totaled $851 million in the Central Gulf of Mexico (CGOM) and $110 million in the Western Gulf of Mexico (WGOM; Table 1).
During 1996-2014, CGOM lease sales generated $17.1 billion in bonus bids compared with $4.6 billion in the WGOM (Fig. 2). Deepwater acreage was responsible for 84% of total bonus revenue in the CGOM and 80% in the WGOM (Fig. 3).
Most oil and gas production is in the CGOM. Today, more than 80% of oil production is from deepwater (>400 m). Production in shallow water has been declining for the past 15 years. Deepwater production is increasing and major finds continue to be announced in the region.
These trends and commodity-price fluctuations reflect differences in opportunities and potential track values. They explain most of the variation in bonus bids across planning areas and water depth.
CGOM acreage is priced at a premium relative to WGOM acreage because of differences in prospectivity and production trends. During 1996-2014, the average bonus bid paid for leases in the CGOM was about twice the price paid in the WGOM (Table 2).
Deepwater deposits tend to be liquids-rich and large-scale with high production rates. This translates into higher bid premiums relative to shallow water tracks. Deepwater CGOM leases sold for an average of $391/acre compared with $172/acre in the deepwater WGOM.
In shallow water, the average bid was $152/acre in the CGOM and $84/acre in the WGOM. Lower bid prices indicate lower perceived prospectivities, less competition, and less interest in acquisition.
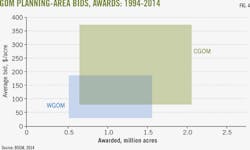
CGOM bid prices and acreage awards are far greater than the WGOM (Fig. 4). Variation in average bid prices is surprisingly low, between one-third to one-half average values, except for the deepwater CGOM where new plays and discoveries have required operators to pay a premium for entry (Table 2). Operator perception of track value and the business models used in determining bid prices appear reasonably stable.
When oil and gas prices are high, operators have more money, leases are worth more, and competition increases, all of which can increase bid prices. Not surprisingly, average bids across planning areas correlate with oil prices (Fig. 5).
Deepwater, shallow water
In deepwater, similar relations exist between average bids and oil prices, but because of the more granular assessment, the correlation is weaker. In shallow water, statistically significant relations were not observed.
In the CGOM, average bids ranged from $100/acre at $20/bbl to $800/acre at $110/bbl. In the WGOM, bids show similar correlations and significantly lower bids when crude prices are high ($250/acre at $110/bbl crude).
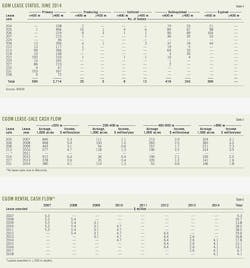
From 2007-14, 4,363 leases were awarded in the Gulf of Mexico (Table 3). The majority of the leases are in deepwater, and as of June 2014, a total of 590 shallow water leases and 2,714 deepwater leases were in primary term (Table 4).
All of the 300 expired leases were awarded before 2009 and are in shallow water, and most of the 659 relinquished leases were awarded before 2010 and are in shallow water.
These data represent a snapshot of activity at a specific point in time. Over time, most primary leases will enter the expired and relinquished categories, and only a few percent will enter the producing and unitized categories.
Lease terms are observable, and after a lease is awarded, it is easy to track its status to assess government rental payments.
If a discovery is made on a lease, production may be brought online before the end of the primary term, and the time the lease generates rent will be shorter than the primary term. The same holds true if the operator decides to relinquish the lease early after seismic testing or an unsuccessful well program.
If the primary term is extended beyond its contract specification because of construction, moratorium, operation, suspension, or other reasons, the government's rent revenue will increase.
Rent generation
In theory, we can track each lease awarded at every sale and determine how long the lease generated rent. In practice, there is no need for this level of detail because most leases are held for the majority of their primary term.
Instead of tracking every lease awarded for every lease sale held during 2007-14, we assume operators hold each lease for the maximum duration and calculate the rent. Table 5 shows rent payments generated in CGOM lease sales during 2007-14 in water shallower than 200 m under this simplifying assumption. Only leases awarded during 2007-14 are examined. Leases awarded before 2007 with primary terms that overlap the evaluation period, and leases awarded after 2014, are not considered.
The total acreage awarded in each lease sale is multiplied by the rental rate for the sale by which an aggregate annual cash payment is identified.
The annual cash payment for each lease sale is figured for its primary term, in this case 5 years for all lease sales, and totaled to yield the expected rental cash flows (Table 6).
The legacy-rent model is repeated for each planning area and water-depth category. The sum of these gives us the expected annual rent for all leases awarded 2007-14 (Table 7, Fig. 6).
In total, leases awarded during 2007-14 are expected to generate about $2.3 billion in rent revenue. They will peak during 2014-16 at about $220 million when the lease inventory is at its maximum, and will end in 2023, 10 years after the deepwater leases awarded in 2014 expire. Rental payments decline as leases expire or transition into their secondary terms.
If rent from future lease sales were included in this evaluation, the peak would increase in magnitude and move out farther into the future.
Including rents from leases awarded before 2007 increases the cash flows in the years before peak, but is not part of GOMESA Phase II.
Exploration, development
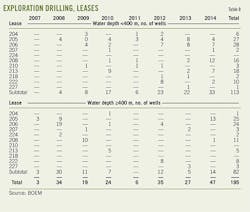
A total of 195 exploration wells have been drilled on leases awarded during 2007-14, 113 in shallow water and 82 in deepwater (Table 8). No deepwater exploration wells were drilled in 2011 due to the Macondo oil spill and deepwater drilling moratorium. As time passes, exploration on the lease inventory will increase with more activity on leases issued in recent sales, and less on older leases.
A total of 87 development wells were drilled on leases awarded during 2007-14, 78 in shallow water and nine in deepwater (Table 9). Leases with the greatest activity are on the oldest leases.
Because successful exploration leads to additional delineation and development drilling, there is a weak correlation between exploration and development activity. Reservoir size, complexity, and development plans are the most significant determinants for development drilling.
Out of 4,363 leases awarded during 2007-14, 164 leases were drilled (3.8%) through June 2014, and 41 leases (1%) achieved production. That the vast majority of leases goes undrilled is an inherent characteristic of the industry. Exploration is risky. Companies only drill those prospects that maximize their economic chances.
Most of the producing wells from leases issued since 2007 are in shallow water. In 2014, there were about 40 producing wells in shallow water and 7 producing wells in deepwater (Fig. 7). In shallow water, most of producing wells are gas wells. In deepwater, most are oil wells.
Production, royalty revenue
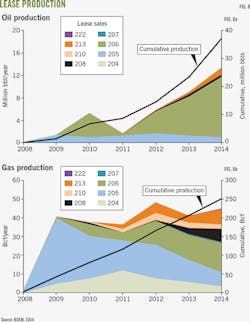
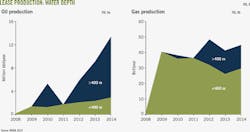
The amount and timing of production depends on lease activity, characteristics of the accumulations, development speed, water depth, and several other factors. Through June 2014, production arising from leases issued during 2007-14 totaled 37 million bbl of oil and 252 bcf of gas (Fig. 8). Most oil production is in deepwater, and the majority of gas production is in shallow water (Fig. 9).
Gross revenue derives from oil and gas production and the sales prices received. Average monthly spot prices for Louisiana Light Sweet and Henry Hub are used as a proxy for sales prices and differences in product quality are not considered.
Gross revenue from leases awarded during 2007-14 totaled $30 million in 2008, $247 million in 2009, $593 million in 2010, $335 million in 2011, $788 million in 2012, $1.14 billion in 2013, and $1.66 billion in 2014 (Fig. 10).
Royalty revenue is determined as a percentage of the gross revenue less allowed transportation and processing fees. Royalty rates are known for each lease, and because transportation and processing fees are minor secondary effects, they are not considered.
During 2008-14, royalty revenue totaled $871 million from $4.8 billion in estimated gross revenue, about 18% on average. This was slightly less than the 18.75% royalty rates on leases issued since 2008 because of the impact of lease sales 204 and 205 where royalty rates were 16.67%.
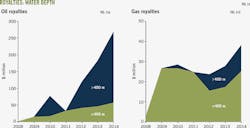
Royalty revenue directly correlates with gross revenue, and was $5 million in 2008, $41 million in 2009, $107 million in 2010, $57 million in 2011, $142 million in 2012, $210 million in 2013, and $308 million in 2014.
About 80% of royalty revenue derives from oil production, and two-thirds from deepwater (Fig. 11). The majority of gas royalty during 2007-14 lease sales is from shallow water. They were a main revenue contributor during 2008-11, but have played a smaller role since.
The author
Mark J. Kaiser ([email protected]) is professor and director, research and development, at the Center for Energy Studies at Louisiana State University. His primary research interests are related to cost, fiscal, and regulatory studies in the oil and gas industry. Kaiser holds a PhD in engineering from Purdue University.

