Smart phone technology enhances field studies
Christopher L. Liner
University of Arkansas
Fayetteville
Throughout northern Oklahoma and Kansas, the Mississippian Lime has emerged as a significant unconventional oil play. The University of Arkansas (UA) is uniquely situated in the Mississippian outcrop belt and has more than 100 years of experience studying these complex reservoir rocks.
Since late 2012 we have been engaged in an outcrop field program termed MArkUP to map the Mississippian Boone limestone formation over 4,000 sq miles. To accelerate progress, we developed methods based largely on commonly available devices and free software. We call this iPhone Geology.
Study area
Mississippian age rocks outcrop in a broad region on and around the Ozark Dome in northern Arkansas and southern Missouri (Fig. 1). This area is about 100 miles west of the subsurface Mississippian Lime oil play of Oklahoma and Kansas, where the target formation ranges in depth 3,000-5,000 ft.
The main Mississippian formation in our study area is the 300-ft thick Boone limestone of Osagian age. The 4,000-sq-mile area has been studied by the US Geological Survey (USGS), Arkansas Geological Survey, professional geologists, and many generations of UA geology graduate students. There are more than 40 UA Mississippian theses spanning 100 years from Gaughan (1913) to Minor (2013), and hundreds of outcrops are known.1 2
Despite this amount of previous work in the area, fundamental questions remain:
• Can Boone outcrop fragments be integrated into a 3D reservoir model?
• What is the origin of silica required to alter limestone into the vast amounts of chert observed in outcrops?
• Why are there at least three varieties of chert, and what are their distributions?
• What fraction of the Boone represents transported sediment?
The Mississippian outcrop belt sits atop the Ozark Dome, a feature that has been prominent since early Mississippian time. The study area is coincident with the paleo shelf break, and there is significant stratigraphic thickening to the south and west. The Miss issippian in this area consists of several units, but our attention here will be on the Boone limestone (Fig. 2).
The scope of this article is to describe the field and lab methods we have developed to prioritize a large number of outcrops over an extensive area in a reasonable amount of time. Our approach has been to exploit low cost or free off-the-shelf technology, making iPhone Geology a viable option for those on a budget, including academics and researchers in developing countries. But the methods are robust and meaningful enough to interest every field geologist. We note in passing that this article is not an endorsement of any particular smart phone or software.
Field methods
The starting point for iPhone Geology is to study outcrops that are not yet in our database. We locate such outcrops by driving through the study area, pulling locations from university theses, and performing careful analysis of surface geology and topography maps or anecdotal data from local residents.3
The first step is to obtain coordinates of the outcrop. We could, of course, use expensive custom GPS equipment if the goal were to have cm-scale resolution. But the interest here is simply to get a reasonable location of the outcrop for later plotting in Google Earth. To that end, we use the free iPhone application (app) named Geolocation that displays latitude, longitude, and altitude with uncertainty (Table 1).
We typically run Geolocation until lateral uncertainty stabilizes to ± 5 m; at which time we selected the "stop updating location" app feature and then took an iPhone screen shot (Fig. 3, upper right inset). In most of our northwest Arkansas locations, we can achieve lateral accuracy of 5-10 m, which is sufficient for our purposes. Screen shots on an iPhone can be produced by pressing and holding "Home" (round button bottom center) and then pressing and releasing the "Sleep" (top right button of phone). Once you hear a camera-like shutter sound, release the Home button.
The Geolocation screen shot goes into the iPhone photo album with a sequential file name and time stamp. Thus, any subsequent photos at this location will have sequential file names below the first screen shot and can be associated with the outcrop in later file management.
Step two is general iPhone reconnaissance photos of the outcrop, with careful attention paid to important stratigraphic, structural, lithological, and related features. Detailed scale photography is typically not done on first occupation of an outcrop site. It is useful, however, to place scale objects in the first photos for later study in the lab.
Fig. 3 includes a standard hazard orange construction level that is exactly 4 ft. When detailed photography is warranted for a particular outcrop, we used a Nikon D600 24.3 megapixel camera, shooting perpendicularly to the rock face in overlapping panels by at least 50% with a scale object included in one or more of the photo panels.
Step three of outcrop delineation is measurement of strike and dip. For this task, we used the inexpensive Theodolite app (Table 1). The heads-up display shows the outcrop image and a variety of coordinate and orientation readouts, including azimuth bearing, elevation angle, and horizon angle (Fig. 4).
The center white crossed lines have fixed orientation to the iPhone, while the yellow box lines remain horizontal as the phone is rotated on a vertical plane. This provides dip measurement by vertical rotation until the white line corresponds to a bedding plane or other feature whose dip is desired.
In the lower right on the Theodolite screen, a camera button can be pushed to trigger a photo of the outcrop and heads-up display. The dip corresponds to the horizon angle reading, representing apparent dip in the plane of the outcrop. Vector dip direction is perpendicular to the photo shoot direction indicated by the azimuth bearing. We typically take three or four Theodolite shots in quick succession and average the results to get dip values accurate to 0.5°.
For the example in Fig. 4, the app identified a dip estimate of 0.6° in the direction n69w (perpendicular to the camera azimuth of n21e). There are other apps that measure dip by placing the device on an exposed bedding plane, but we find bedding planes are rarely exposed in our carbonates and the bedding we do encounter is too irregular for such a measurement. The Theodolite app dip method is more robust.
Indexing field data
Once initial field work is completed, the data require storage and indexing in such a way that outcrop sites and data can be quickly connected long after the original site visit.
Keeping with the theme of inexpensive, off-the-shelf solutions, we organize the data for quick reference by a consistent folder-naming scheme. The data gathered on a given day reside in a folder whose name follows the convention "YYYYMMDDobs_keyword" where YYYY is year, MM is month, DD is day, obs are initials of the field observer, and keyword is a short indicator of the site or geology.
For example, the folder named 20130121CLL_Miss contains photos and other data gathered on Jan. 21, 2013, by CLL (Chris Liner) and the sites visited were Mississippian. Inside this folder, all iPhone images are sequential as, 1. Geolocation screen shot for latitude-longitude, 2. photos and Theodolite screen shots in the order taken.
A useful detail for the iPhone is that file name extensions are different for screen shots (PNG), Theodolite dip shots (JPG), and photos (jpg). When the same site is visited again, a subfolder in the first occurrence is created with the same naming convention plus a leading underscore to force the follow-up folders to the top of the list (ahead of first visit photos, etc.). Thus, all the items in this folder 20121114CLL_Miss/_20140217CLL_Miss are data gathered on Feb. 17, 2014, by CLL at a site first visited on Nov. 14, 2012.
Naming conventions and data organization become increasingly important with the amount of data gathered. Currently, MArkUP has more than 6,000 indexed photos on more than 180 outcrop locations. This folder and file-naming system allows us to use the native file system on Mac or PC systems as a free database.
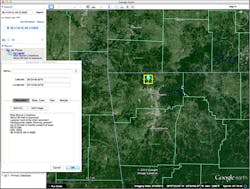
In addition to systematically organizing data files, it is necessary to map outcrop locations. For this we use Google Earth (GE) based on latitude-longitude coordinates gathered by the Geolocation app. To organize outcrop sites in GE, we follow our usual folder-naming convention in the GE sidebar tree.
It is important to have file folders and GE folders in sync for quick connection of sites and associated data. Fig. 5 shows a typical GE site entry with color-coded pin bubble (blue for Mississippian) and basic site description in the pin information box. In addition to outcrops we have many other data site types, including quarries, boreholes, and outcrops reported in earlier theses (Fig. 6).
Data analysis
With indexed outcrop photos and related data available, it is possible to perform a variety of geological analyses. A few examples will be given here.
• Boone fragments. In the study area, the Miss Boone formation is about 300-ft thick. The full section is never seen in a single outcrop and most exposures reveal no more than 40 ft (13%) of the Boone section. Thus, individual outcrops contain only a fragment of the entire Boone and this is further complicated by lateral variation of lithology, depositional setting, and diagenetic alteration.
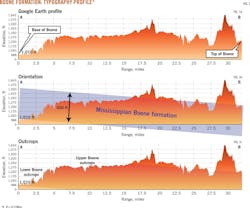
Without the larger view afforded by iPhone geology, it is difficult to place outcrops in context (upper, middle, or lower Boone). Our method of addressing this problem is through the use of contacts and the GE elevation profile function (Figs. 6 and 7). In Fig. 6, the white dashed line connects Point A (basal Boone contact) with B (upper Boone contact). Fig. 7's upper plot shows a GE elevation profile pulled between points A and B. Assuming the Boone is unfaulted, we can lay it into the elevation profile as a 300-ft thick rectangle (blue), using the contact points as control (Fig. 7, middle).
Cropping the Boone rectangle along topography gives the result in the lower plot of Fig. 7; this can be used to estimate stratigraphic position of outcrops along the A-B line and as a guide for new outcrop searches.
• Stacking patterns. High-resolution photos of outcrops with calibration scale can be used to quantify many aspects of rock formations. For extensive outcrops, shooting overlapping panel photographs allows generation of a photomontage using Hugin or other open-source software. We use the free medical imaging program ImageJ to set scale on photographs and make precise measurements (Table 1).
ImageJ can open most graphic file formats, including jpg, which is common with digital cameras. To set scale on a photo, select the magnify tool and zoom in on the scale bar; select the line tool and drag a line to the length of the calibration bar; then select menu item Set Scale. This brings up a dialog box with pixel length of the line on the calibration bar where the user can input the true bar length in preferred units. Input a pixel aspect ratio of 1.0, and name the units in the appropriate box. In this way, the entire photo becomes scale calibrated for measurements to an accuracy of 1-5 in., depending on camera resolution, lens, and distance from the outcrop.
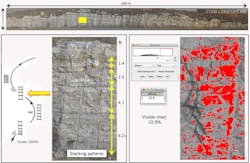
One important application is quantification of stacking patterns. Fig. 8 (upper) shows a Boone outcrop near Siloam Springs, Ark., as a calibrated montage with a pixel size of 0.01 ft. The boxed (yellow) area reveals intervals of limestone and chert with clear bedding breaks in the lower left detail plot. These breaks are carbonate hardgrounds, intervals of non-deposition due to relative sea-level rise.
Higher sea level means carbonate production moves to shallower areas and the seafloor has a prolonged time of bioturbation (marine animals burrowing in the seafloor). This makes a slightly irregular surface that is seen in outcrop as a sharp bedding plane. When sea level next drops, lime mud is deposited on the hardground surface representing a low-energy environment below wave base. Further fall of sea level begins deposition of limestone with chert replacement, and the cycle continues.
The thickness of layers between hardgrounds is termed the stacking pattern and is an indicator of lower-order sea level rise and fall.4 This particular outcrop indicates an upward thinning stacking pattern associated with overall falling sea level (LST = lowstand systems tract).
Such indicators can be important correlation tools from one outcrop to the next and help build the overall depositional history of the Boone.
• Quantitative lithology. Outcrop photos also can be used to make quantitative estimates of lithology with ImageJ. This method is viable if the photo lighting is good (no direct sun as it causes shadows) and when the lithology components differ in color.
The Boone formation contains limestone (gray, tan) and chert (white, black, light tan). The ImageJ process for lithology analysis of an outcrop photo is to select menu item Image > Type > 8-bit to convert the photo to 8-bit grayscale, then select menu Image > Adjust > Threshold to get a slider that controls image threshold (red color) and adjust the control until the lithology of interest is red, the final step is to select menu Analyze > Measure to get the percentage area represented by the threshold.
The menu item Analyze > Set Measurements offers a wide array of quantities that can be invoked by the threshold measure technique, but only Area Fraction is illustrated here (Fig. 8).
The example in Fig. 8 (lower right) segments white chert against a gray limestone matrix; the result shows that 10.9% of the visible rock is chert. Assuming the outcrop is an arbitrary slice through the rock volume, this is also a good estimate of volume fraction of chert. In the Miss Lime play of Oklahoma and Kansas, the fraction of chert is an important indicator of fracability and reservoir permeability.
Open-source geology
Modern smart-phone technology and open software has the potential to revolutionize field geology, certainly in the US but also anywhere in the world. We have described an integrated method of mapping surface geology in northwest Arkansas, but the same methods have been successfully tested in the Spanish Pyrenees working with Cretaceous carbonates.
These methods can yield key information about exposed rock units, including structure (strike, dip, and fracture orientation and density), stratigraphy (detailed thickness variations, unconformities, and depositional dip), and lithology (area and volume fraction). Reconnaissance geology of vast areas can now be undertaken with a reasonable amount of time, effort, and cost.
Acknowledgments
The author thanks Shane Matson, Doy Zachry, Walter Manger, and Robert Liner for many useful discussions. Students involved in this work include John Gist and Thomas Liner.
References
1. Gaughan, J.E., "A study of concretions in the Fayetteville Shale formation near Fayetteville, Arkansas," MS thesis, University of Arkansas, 1913.
2. Minor, P.M., "Analysis of Tripolitic Chert in the Boone Formation (Lower Mississippian, Osagean), Northwest Arkansas and Southwestern Missouri," MS thesis, University of Arkansas, 2013.
3. Liner, C.L., Zachry, D., and Manger, W.L., "Mississippian characterization research in NW Arkansas," Search and Discovery, Article #41245, AAPG Midcontinent Meeting, Wichita, Kan., Oct. 12-15, 2013.
4. Tucker, M.E., "Carbonate Diagenesis and Sequence Stratigraphy," Sedimentology Review 1, 2009, pp. 51-72.
The author


