Relative velocity factor advances internal tee erosion prediction
Nan Lin
Hui-qing Lan
Yu-Gong Xu
Beijing Jiaotong University
China
Ren-yang He
China Special Equipment
Inspection and Research Institute
Beijing
Development of a relative velocity factor comparing inlet flow rates of gas pipeline tees can predict the maximum erosion position inside the tee. A simulation model combining the k-ε turbulent and Lagrange discrete phase models allows analysis of the maximum erosion of tees based on path line, pressure, turbulent intensity, and relative tangential velocity in the tee. Results of the simulation are similar to those found in a failed tee in China's Dina gas field.
Particular gas sources and erosion can result in solid particles (dust) in gas pipelines (OGJ, Mar. 12, 2007, p. 52). These particles can cause further erosion and damage the pipelines.1 Defects caused by erosion can greatly affect pipeline safety (OGJ, Jan. 6, 2014, p. 94).
As key components of natural gas pipelines, tees typically gather gas from two paths or separate flow into two paths. Studies on tee erosion remain limited and have focused mainly on simulations and laboratory tests.2-6
This article investigates damage to tees with two inlets and one outlet under working conditions in the Dina gas field by combining the k-ε turbulent and Lagrange discrete phase models. Flow-field analysis in tees reveals the influence of changes in flow velocity from the two inlets on the position of tee erosion. To establish a convenient method for predicting the erosion positions of tees under working conditions, researchers proposed a relative factor between the velocities of two inlets and compared predicted results with those cited in the field report.
Turbulence model
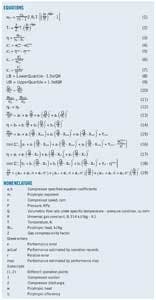
Turbulent viscosity μt can be expressed as a function of k and ε (Equation 1, see accompanying box).7 Equations 2-9 provide the transport equation of the standard k-ε model.8-9
Lagrange discrete-phase model
Two-phase gas-solid studies typically use the Euler-Lagrange method.10 The gas is a continuous phase, the solid particles a dispersed phase, and the Lagrange coordinate describes particle tracks.11 Particle movement follows Newton's second law.12
Tee flow-field analysis
Flow field velocity is redistributed as the shapes of pipelines change.13 Fig. 1 shows the flow field in the main line of the tee being influenced by the flow in the branch line. Local pressure drops near the tee junction, with Fig. 1's red lines showing local circumfluence. Fig. 1a shows particle tracks when Inlet 2 velocity (flow from the branch line) is low, with maximum erosion occurring on the branch-line side of the wall inside the tee. Fig. 1b shows Inlet 2 particle tracks when velocity is high. Maximum erosion is on the wall opposite the branch line's inlet into the tee.
Failure analysis
Erosion caused a 2010 accident at Tee DN2-6 of Dina gas field in China, sharply limiting gas transport. Fig. 2 shows the broken tee under working conditions.14 Erosion occurred mostly on the branch-line side and lower reaches of the wall inside the tee. Gravity caused maximum erosion to occur toward the bottom of the tee.
Table 1 shows the size of broken Tee DN2-6 and operating parameters of the Dina pipeline. Tee DN2-6 is 16 Mn (manganese) high-strength, low-alloy steel with a carbon content of 0.16%. Table 2 shows its mechanical properties.15
ASME proposes the calculation method for determining safe pipeline operating pressure (Equations 11-13).16 When applied to the pipeline's operating parameters and mechanical properties the ASME method yields an 8.6-mm minimum safe wall thickness. The pipeline's minimum design WT is 9.6 mm.15
Table 3 shows test data of the tees in Dina gas field. The WT of Tee DN2-6 was less than the safety WT, causing the accident.
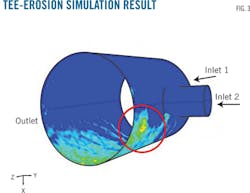
The working conditions listed in Table 2 provided the basis for a simulation model of the broken tee combining the k-ε turbulent and Lagrange discrete phase models.17-18 Particle diameter and flow rate used were 0.2 mm and 0.003 kg/sec, respectively. Calculation results showed the volume fraction of lower than 10%. The study used the Lagrange method to simulate particle phase. The simulation result shown in Fig. 3 was similar to that detailed in the engineering accident report. Maximum erosion occurred in the red circle shown in Fig. 3. The erosion rate calculated from the engineering test report was 1.693 ×10⁻⁷ kg/sq m-sec and that from the simulation 1.943 × 10⁻⁷ kg/sq m-sec, exhibiting good agreement.
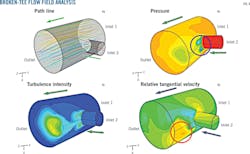
Flow field can provide the basis for analyzing tee erosion.19-20 Fig. 4a, 4b, 4c, and 4d, respectively, show the path, pressure, turbulence intensity, and relative tangential velocity of the tee.
Fig. 4a shows that the path changed when the flow was from the branch line to the main line as the backflow occurred. In Fig. 4b, the pressure in the backflow position (inside the blue circle) was low, such that the flow returned and became backflow.
As the pressure changed, the turbulent intensity increased in the same position (Fig. 4c). Fig. 4d shows the maximum relative tangential velocity of the tee, inside the red circle. Relative tangential velocity was the main erosion factor, the position of maximum relative tangential velocity and maximum erosion being the same. Simulation results were similar to those from field inspection.
Tee-erosion prediction
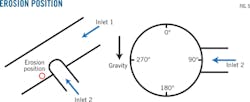
Inlet 1 and Inlet 2 velocities in gas pipelines actually differ under working conditions, significantly influencing the maximum erosion position in tees. Prediction of the maximum erosion position under different velocities therefore has important implications to the protection of tees during engineering. Indicating the erosion position of tees under different velocities requires setting the angle calibration of the tee as shown in Fig. 5.
Table 4 shows the test data of tee erosion in Dina gas field.16 The position of minimum tee wall thickness changed when velocities of flows in the main line Inlet 1 and the branch line (Inlet 2) differed.
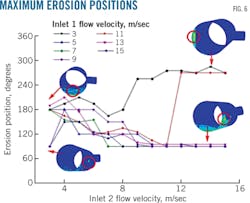
Fig. 6 shows the maximum erosion position of tees simulated under different working conditions based on the working conditions of Dina gas field. When the velocity of Inlet 1 was low (~3-5 m/sec), maximum erosion occurred on the wall of the far side of the branch line (270° position) as Inlet-2 velocity increased. When the velocity of Inlet 1 was high (~13-15 m/sec), maximum erosion occurred in the tee junction when Inlet-2 velocity was low. With increasing velocity, maximum erosion occurred on the wall of the tee near the branch line (90° position). When velocity of Inlet 2 was low and velocity of Inlet 1 was 3-13 m/sec, maximum erosion occurred at the tee's bottom.
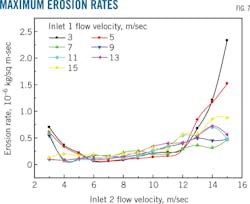
Fig. 7 shows the relationship between maximum erosion rate and Inlet 1 and 2 velocities. The maximum erosion rate of tees under different velocities of Inlet 1 increased as the velocity of Inlet 2 increased, but not rapidly. When the velocity of Inlet 1 was low, maximum erosion occurred on the wall of the opposite side of the branch line. Increasing velocity's influence was more evident, therefore, when the velocity of Inlet 2 was high (greater than 12 m/sec) and the velocity of Inlet 1 low (3-5 m/sec).
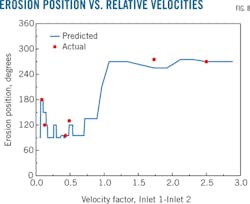
Summarizing maximum erosion positions of the tees under different velocities allowed development of a relative factor k between the velocities of Inlet 1 and Inlet 2 to describe the relation between the maximum erosion positions and velocities (Equation 14). Undetermined coefficient a = 0.013 under working conditions in Dina gas field.
Fig. 8 shows the relation between relative factor k and the maximum erosion positions of the tees. Fig. 8 also compares the predicted and real damage positions shown in Table 4, with predicted results close to actual. Maximum erosion occurred near the 270° position when the relative factor k was more than 3.
Equations
Acknowledgement
This project was supported by the National High Technology Research and Development Program of China and Special Fund for Quality Inspection Scientific Research in the Public Interest.
References
1. Achebo, J.I., "Pipeline Using the Drift Flux Models based on Eulerian Continuum Equations," Proceedings of the World Congress on Engineering 2009, IWCE 2009, London, July 1-3, 2009.
2. Chen, X.H., Mclaury, B.S., and Shirazi, S.A., "Application and Experimental Validation of a Computational Fluid Dynamics (CFD)-based Erosion Prediction Model in Elbows and Plugged Tees," Computers & Fluids, Vol. 33, No. 10, December 2004, pp. 1,251-1,272.
3. Chen, X.H., Mclaury, B.S., and Shirazi, S.A., "Numerical and Experimental Investigation of the Relative Erosion Severity Between Plugged Tees and Elbows in Dilute Gas/Solid Two-phase Flow," Wear, Vol. 261, No. 7-8, Oct. 20, 2006, pp. 715-729.
4. Brown, G.J., "Erosion Prediction in Slurry Pipeline Tee-junctions," Applied Mathematical Modelling, Vol. 26, No. 2, February 2002, pp.155-170.
5. Takahashi, K., Kato, A., and Ando, K., "Fracture and Deformation Behaviors of Tee Pipe with Local Wall Thinning," Nuclear Engineering and Design, Vol. 237, No. 2, January 2007, pp.137-142.
6. Graham, L.J.W., Lester, D.R., and Wu, J., "Quantification of Erosion Distributions in Complex Geometries," Wear, Vol. 268, No. 9-10, Mar. 25, 2010, pp. 1,066-1,071.
7. Bertodano, M.L., Lahey, R.T., and Jones, O.C., "Development of a k-ε Model for Bubbly Two-phase Flow," Journal of Fluids Engineering, Vol. 116, No. 1, March 1994, pp. 128-134.
8. Pope, S.B., Turbulent Flows. Cambridge University Press, 2010.
9. Xiong, Y.Q., Yuan, Z.L., and Zhang, M.Y., "Three-dimensional Numerical Simulation on Conveying Properties of Gas-solid Injector Under Pressurization," China Journal of Chemical Industry, English, Vol. 55, No. 10, October 2004, pp. 1,638-1,643.
10. Darmana, D., Deen, N.G., and Kuipers, J.A.M., "Parallelization of an Euler-Larange Model Using Mixed Domain Decomposition and a Mirror Domain Technique: Application to Dispersed Gas-liquid Two-phase Flow," Journal of Computational Physics, Vol. 220, No. 1, Dec. 20, 2006, pp. 216-248.
11. FLUENT 6.3 User's Guide[Z], Fluent Inc, Lebanon, NH, 2006.
12. Zhong, W.Q., "DEM Simulation of Gas-solid Flow Behaviors in Spout-fluid Bed," Chemical Engineering Science, Vol. 61, No. 5, March 2006, pp. 1,571-1,584.
13. Crowe, C.T., Engineering Fluid Mechanics, John Wiley & Sons, Hoboken, NJ, 2009.
14. CNPC, "Report of the Gathering Pipelines Detection Data in Dina 2," Beijing, 2012.
15. GB/T 8163-2008, Seamless Steel Tubes for Liquid Service [Standard], China, Apr. 1, 2009.
16. ASME B31G-2009, Manual for Determining the Remaining Strength of Corroded Pipelines, New York, American Society of Mechanical Engineers, 2009.
17. Suzuki, M., Inaba, K., and Yamamoto, M., "Numerical Simulation of Sand Erosion in a Square-section 90-degree Bend," Journal of Fluid Science and Technology, Vol. 3, No. 7, July 2008, pp. 868-880.
18. Kaushai, D.R., Thinglas, T., and Tomita, Y.J., "CFD Modeling for Pipeline Flow of Fine Particles at High Concentration," International Journal of Multiphase Flow, Vol. 43, July 2012, pp. 85-100.
19. Wu, L.Y., Wang, Y.L., and Wang, Z.D., "Study on the Influence of Internal Flow Field in Pipeline Elbow by the Guide Plate," Advanced Materials Research, Vol. 142, No. 10, October 2010, pp. 130-133.
20. Njobuenwu, D.O., and Fairweather, M., "Modeling of Pipe Bend Erosion by Dilute Particle Suspensions," Computers and Chemical Engineering, Vol. 42, July 2012, pp. 235-247.
The authors
Nan Lin ([email protected]) is a PhD candidate in vehicle operation engineering at Beijing Jiaotong University, Beijing. He holds an MS (2013) from Beijing Jiaotong University.
Hui-qing Lan ([email protected]) is an associate professor at Beijing Jiaotong University. She also completed postdoctoral work at the University of Tokyo. Lan holds a PhD in engineering (2002) from China University of Petroleum, Beijing, and is a member of the Petroleum Storage & Transportation Committee of China Petroleum Society.
Yu-Gong Xu ([email protected]) is a professor at Beijing Jiaotong University. He holds a PhD from Dresden University of Technology, and completed postdoctoral work at Dresden University of Technology and Chemnitz University of Technology.
Ren-yang He ([email protected]) is a senior researcher at China Special Equipment Inspection and Research Institute, Beijing. He holds a PhD in engineering (2001) from China University of Petroleum, Beijing, and is a member of Chinese Society of Corrosion and Protection.


