Simplified LWD method improves geosteering, well placement
Pedro Anguiano-Rojas
Douglas J. Seifert
Saudi Aramco
Dhahran
Michael Bittar
Sami Eyuboglu
Yumei Tang
Burkay Donderici
Halliburton Energy Services Inc.
Dhahran
With the recent advancements in directional drilling and the use of rotary-steerable systems, more deviated and horizontal wells are being drilled and evaluated around the world, especially in Saudi Arabia. In these complex reservoirs, logging while drilling (LWD) wave-propagation allows accurate geosteering and well placement.
Since the introduction of LWD resistivity tools in the 1980s, there has been continuous advancement in features and capabilities. The first such tool was introduced in 1983 with a single frequency, single spacing, and single depth of investigation.1 Multiple spacing, multifrequency LWD resistivity tools were later designed,2-5 and compensated-LWD resistivity tools were introduced in 1989.6-8
Most wave-propagation tools followed the traditional design of coaxial transmitters and receivers. These conventional tools were used for geosteering but suffered from a lack of azimuthal sensitivity, which provides the directional information needed to make proactive geosteering decisions. The introduction of directional LWD in 2000 enabled more accurate well placement in more complex and hard-to-reach reservoirs.9-11
Directional LWD technology often has trouble near boundaries between formations with differing resistivities. The result is boundary artifacts, or horns. This is especially true when the borehole penetrates formations at an angle. These artifacts make interpretation imprecise. Determining the true formation resistivity becomes difficult.
This article presents a simplified processing method to reduce or eliminate these disruptive artifacts. Data processing, inversion schemes, and test results are presented to support this methodology.
Azimuthal ADR
The azimuthal deep-reading resistivity (ADR) tool is a multifrequency, multiple-spacing LWD tool with tilted antennas that give the tool its azimuthal sensitivity. ADR has six transmitters and three receivers and transmitter-to-receiver distances of 16 in. to 112 in. The receiver antennas are tilted 45° from the tool axis (Fig. 1).
The tool operates at three frequencies-2 Mhz, 500 khz, and 125 khz-and has three compensated spacings-16 in., 32 in., and 48 in.12 The multiple frequencies and spacings cover the entire range, from very shallow to very deep, allowing formation-resistivity mapping from near the borehole to 20 ft away, radially.13 14
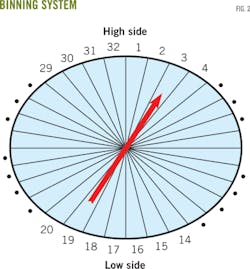
Resistivity readings are performed at 32 regularly spaced, angular positions called bins (Fig. 2). Bin 1, referred to as the up bin, is that sector for which the angle between the coordinate vertical vector pointing upwards and the magnetic moment of the tilted receiver (vector normal to the surface of the receiver coil, using the right-hand convention for the winding direction of the coil) is minimum in a deviated well. Conversely, Bin 17, referred to as the down bin, is that sector for which this angle is maximum.
In addition to the 32 azimuthal resistivity measurements, an average resistivity is produced from the measured 32-bin phase difference or attenuation; the tool transforms them to phase and attenuation resistivity, respectively, through homogeneous resistivity transforms.
All azimuthal readings are equal if the measurements are not affected by adjacent layers. When the well approaches a layer boundary, azimuthal readings demonstrate characteristic differences that indicate the well has entered or exited a formation.15
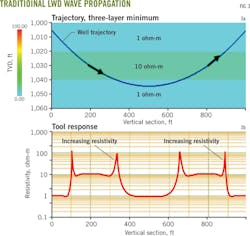
Traditional LWD wave propagation tools lack the azimuthal sensitivity to provide directional information.12 Figs. 3a and 3b illustrate the computed response of a traditional LWD wave-propagation tool in a 10 ohm-m formation that is bounded by two conductive beds of 1 ohm-m.
As the tool approaches the resistive bed from the top, it starts to read the high resistivity (polarization effect). As the tool approaches the conductive lower formation at the bottom, it also starts to read high resistivity (similar polarization effect).
The tool reading is the same whether the tool approaches the conductive formation from the top or the bottom. This similarity stems from the lack of azimuthal sensitivity, which, consequently, makes geosteering uncertain.12
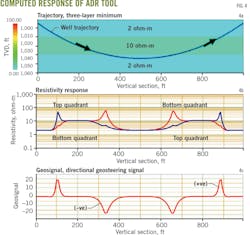
The computed response of the ADR tool is shown, as well. Fig. 4a shows the well trajectory, Fig. 4b shows the high-side and low-side resistivities, and Fig. 4c shows the geosignal, or the directional geosteering signal.12
The geosignal is the difference between measurements from the opposite azimuthal orientations of the tool. As the tool approaches the bottom formation, the low-side resistivity (resistivity from Bin 17) reads as a much lower resistivity, indicating that the tool is approaching a conductive bed from the bottom of the high resistivity zone.
When the tool approaches the conductive bed from the top of the high resistivity zone, the high side resistivity (resistivity from Bin 0) reads as a lower resistivity, indicating that the tool is approaching the conductive zone from the top of the high resistivity zone.
The directional geosteering signal decreases as the tool approaches the conductive boundary from the bottom of the high resistivity zone and increases as the tool approaches the conductive boundary from the top of the high resistivity zone.
Inversion methodology
Before the drilling of a target well, offset wells drilled in the same area can provide useful data, such as the expected resistivity and thickness of formation layers. These data can be used as "known parameters" for a simple distance-to-boundary inversion.
Although the distance-to-boundary inversion can be a fast calculation, the accuracy of the inversion result is reduced if the actual resistivity values are different from the assumed values. To improve accuracy, we developed a flexible inversion method without resistivity input.
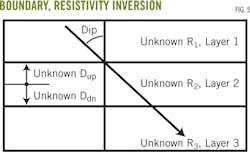
The new method targets the solution of layer resistivities and boundary positions with a Gauss-Newton minimization scheme. Parameterization of formation unknowns uses a three-layer model, in which Dup is the distance to the up boundary and Ddn is the distance to the down boundary, with the tool assumed to be in the intermediate layer (Fig. 5).
This method is based on an iterative, 1D-forward model that minimizes the difference between the raw measurement and the simulated response, obtaining true formation parameters. The inversion is performed independently at each logging point to avoid bias from past measurements. The dip angle is input as a fixed value. The equation for this methodology appears in the box on the previous page.
This new inversion method processes simple formation structures with a single boundary, such as a two-layer formation model. The one-boundary inversion has handled complex cases more effectively when only one shoulder layer provides the dominant effect on the response and the contribution of another layer is too weak to estimate its property. 16
Advanced interpretation
Two field tests demonstrate the effectiveness of this new inversion method. Fig. 6 illustrates the field-recorded ADR geosignal and resistivity-log data for an interval of the first test well (Test Well 1). Fig. 6a presents the up and down attenuation geosignal curves of the 48-in. spacing (Ga48b1 and Ga48b17) for the operating frequency of 500 khz.
Fig. 6b displays the average, as well as the up and down-phase resistivity curves of the 16-in. spacing at 500 khz (Ppavg16, Rp16b1, and Rp16b17).
Large separations between up and down readings are observed in both the geosignal and resistivity values at x0700 ft, x0800 ft, x0900 ft, and x1,600 ft, indicating that the tool is approaching a boundary.
The overlap of responses in other sections indicates that the tool is far from the boundary or that the logging point is at the electrical middle, a point that has canceling effects from the upper and lower layers.
The inversion method obtains the resistivities of the three layers and the distances to the up and down boundaries where the dip angle is assumed to be 80°, making it adequate for the point-by-point inversion.
Fig. 7a illustrates the overall well placement in the formation. The well path appears as the blue curve and the inverted up and down boundary positions in green and red, respectively.
In this case, the well trajectory is in a thin resistive layer, about 5-ft thick. It approaches the top layer (Layer 1 in Fig. 5) at x0700 ft and x0900 ft and approaches the bottom layer (Layer 3 in Fig. 5) at x0800 ft and x1,400 ft.
Fig. 7b shows the resistivity obtained from the inversion. This confirms that the hosting layer is more resistive than the top and bottom layers.
Fig. 8 shows the comparison between raw responses and ADR-simulated data obtained from the inverted formation parameters for verification and quality control. In Fig. 8a, the raw average resistivities of 16 in., 32 in., and 48 in. (Rpavg16, Rpavg32, and Rpavg48, respectively) are plotted and compared with simulated data (Rpavg16s, Rpavg32s, and Rpavg48s).
Fig. 8b includes four curves: The raw up attenuation geosignal of 48 in. (Ga48b1), the down attenuation geosignal of 96 in. (Ga96b17), and their respective simulated responses (Ga48b1s, Ga96b17s), with the final inverted resistivity and boundary position.
There is good agreement among the measurements and simulation data for both the resistivity and geosignal responses.
Fig. 9 shows the field ADR geosignal and average resistivity log data for a second test well (Test Well 2). The dip angle is, again, assumed to be 80°. Fig. 9a shows the up and down attenuation geosignal curves of the 48-in. transmitter receiver pair at 500 khz (Ga48b1 and Ga48b17). Fig. 9b shows the up, average, and down-phase resistivity curves of the 16-in. transmitter receiver pair at 500 khz (Rp16b1, Rpavg16, and Rp16b17).
Obvious separations between the up and down readings appear in the geosignal values in the middle of the section, indicating that the tool is near a boundary. The overlapping responses at the start and end of the section indicate that the tool is electrically far from the boundary or that the logging point is at the electrical middle point of the zone (where the electrical effect of the hosting layer's top and bottom boundaries cancel each other).
The resistivity plot shows three curves (Rp16b1, Rp16avg, and Rp16b17). Each is higher than 10 ohm-m. The down resistivity reading (Rp16b17) reaches as high as thousands of ohm-m, which indicates the tool is very close to the boundary between two high-contrast layers.
The up-resistivity reading is higher than the down-resistivity reading at the section from x020 ft to x080 ft, and lower than the down resistivity reading after x080 ft. This indicates that the well may have penetrated a layer boundary.
Because the well is near a single boundary and ADR measurements are mainly affected by the two closest layers, the one-boundary-inversion method is suitable for handling these types of data.
Fig. 10 presents the inversion results of the boundary position and resistivity values of the two layers using the single-boundary-inversion method.
In Fig. 10a, the well path is in blue with the nearest formation boundary location in green. The borehole follows the top interface at about 1-ft along the intervals from x080 ft to x800 ft. An approach to the bottom layer appears from x020 ft to x080 ft and again, briefly, at x810 ft.
The inversion results for the resistivity of the two layers (Rmid, Rmin) for the interval from x080 ft to x800 ft appear in Fig. 10b. Rmid, which is the resistivity of the hosting layer in which the borehole well trajectory is moving, ranges from 30 ohm-m to 100 ohm-m. The shoulder layer resistivity, Rmin, averages about 4 ohm-m.
In the interval between x020 ft, x080 ft and x810 ft, the opposite behavior is observed: The shoulder layer has a higher resistivity than the hosting layer, implying that the well trajectory approached the bottom layer more than the top layer during drilling.
From the boundary and resistivity inversion results, the well trajectory is observed to be in a highly resistive formation. It approaches the bottom, low-resistivity layer at x020 ft, moves back up to the top of the high-resistivity layer at x080 ft, and, finally, makes a second approach to the bottom layer at x800 ft.
Fig. 11a displays a comparison between the raw measurements and the simulated data for the inversion result in Fig. 10. Again, good agreement appears in comparison of the average resistivity at 16 in. As expected, the strong polarization effect induces larger discrepancies for the average resistivity at 32 in. and 48 in.
The comparison between the raw and simulated attenuation geosignals in Fig. 11b for the 48-in. up bin, Bin 1, and the 96-in. down bin, Bin 17, illustrates a good match even for the 96-in. spacing, which reads deeper into the medium in the downward direction and is included here for verification purposes.
References
1. Rodney, P.F., Wisler, M.M., Thompson, L.W., and Meador, R.A., "The Electromagnetic Wave Resistivity MWD Tool," presented to the 58th Annual Technical Conference and Exhibition, San Francisco, Oct. 5-8, 1983.
2. Fredericks, P.D., Hearn, F.P., and Wisler, M.M., "Formation Evaluation While Drilling with a Dual Propagation Resistivity Tool," presented to the SPE Annual Technical Conference and Exhibition, San Antonio, Oct. 8-11, 1989.
3. Rodney, P.F., Mack, S.G., Bittar, M.S. and Bartel, R.P., "An MWD Multiple Depth of Investigation Electromagnetic Wave Resistivity Sensor," presented to the SPWLA 32nd Annual Logging Symposium, Midland, Tex., June 16-19, 1991.
4. Bittar, M., and Rodney, P.F, "The Effect of Rock Anisotropy on MWD Electromagnetic Wave Resistivity Sensor," presented to the SPWLA 35th Annual Logging Symposium, Tulsa, June 19-22, 1994.
5. Meyer, W.H., "New Two Frequency Propagation Resistivity Tools," presented to the SPWLA 36th Annual Logging Symposium, Paris June 26-29, 1995.
6. Clark, B., Allen, D.F., Best, D.L., Bonner, S.D., Jundt, J., Luling, M.G., et al., "Electromagnetic Propagation Logging While Drilling: Theory and Experiment," SPE Formation Evaluation, Vol. 5, No. 3, September 1990, pp. 263-271.
7. Strickland, R.W., Merchant, G.A., Haugland, M., and Gianzero, S., "New Developments in 2 MHz Electromagnetic Wave Resistivity Measurements," presentation to the SPWLA 35th Annual Logging Symposium, Tulsa, June 19-22, 1994.
8. Meyer, W.H., Thompson, L.W., Wisler, M.M. and Wu, J.Q., "A New Slimhole Multiple Propagation Resistivity Tool," presented to the SPWLA 35th Annual Logging Symposium, Tulsa, June19-22, 1994.
9 Bittar, M., U.S. Patent No. 6,163,155, "Electromagnetic Wave Resistivity Tool Having a Tiled Antenna for Determining the Horizontal and Vertical Resistivities and Relative Dip Angle in Anisotropic Earth Formations," Dec. 19, 2000.
10 Bittar, M., U.S. Patent No. 6,476,609, "Electromagnetic Wave Resistivity Tool Having a Tilted Antenna for Geosteering within a Desired Payzone," Nov. 5, 2002.
11 Li, Q., Lui, C.B., Maeso, C., Wu, P., Smith, J., Prabawa, H., et al., "Automated Interpretation for LWD Propagation Resistivity Tools through Integrated Model Selection," presented to the SPWLA 44th Annual Logging Symposium, Galveston, June 22-25, 2003.
12 Bittar, M., Klein, J., Beste, R., Hu, G., Wu, M., Pitcher, J., et al., "A New Azimuthal Deep-Reading Resistivity Tool for Geosteering and Advanced Formation Evaluation," presented to the SPE Annual Technical Conference and Exhibition, Anaheim, Cal., Nov. 11-14, 2007.
13 Seifert, D.J., Al-Dossary, S.M., Chemali, R., Bittar, M., Lofty, A., Pitcher, J., et al., "Deep Electrical Images, Geosignals, and Real Time Inversion Help Guide Steering Decisions," presented to the SPE Annual Technical Conference and Exhibition, New Orleans, Oct. 4-7, 2009.
14. Seifert, D.J., Chemali, R., and Bittar, M.S.,"The Link between Resistivity Contrast and Successful Geosteering," presented to the SPWLA 52nd Annual Logging Symposium, Colorado Springs, May 14-18, 2011.
15. Pitcher, J., Bittar, M., Hinz, D., Knutson, C., and Cook, R., "Interpreting Azimuthal Propagation Resistivity: A Paradigm Shift," presented to the SPE EUROPEC/EAGE Annual Conference and Exhibition, Vienna, May 23-26, 2011.
16. Donderici, B., Pitcher, J., Tang, Y., Bittar, M., Cook, R., and Knutsen, C., "Inversion Processing for Dual Boundaries: Comparative Case Histories," presented to the SPWLA 53th Annual Logging Symposium, Cartagena, Colombia, June 16-20, 2012.
Flexible Inversion Method
Based on a presentation to the SPE Saudi Arabia Section Annual Technical Symposium and Exhibition, al-Khobar, May 19-22, 2013.
The authors
Pedro Anguiano-Rojas ([email protected]) is a petrophysics consultant for QRI and PEMEX. He was previously the resistivity logging specialist in the reservoir description department for Saudi Aramco. He holds a MS in geomathematics from Stanford University and a PhD in geophysics from the Colorado School of Mines. He is a member of SPWLA and SPE.
Douglas J. Seifert ([email protected]) is the petrophysics professional development advisor in Saudi Aramco's upstream professional development center where he oversees the petrophysics curriculum and development of petrophysicists. He holds a BS in statistics and an MS in geology, both from the University of Akron, Ohio.
Michael Bittar ([email protected]) is senior director of technology for Halliburton, Houston. He holds a BS, MS, and PhD degrees in electrical engineering from the University of Houston. Bittar is a member of SPE and SPWLA.
Sami Eyuboglu (sami.eyubogulu) is a program manager at the Halliburton Dhahran Technology Center. He holds BS and MS degrees in mining engineering from the Hacettepe University, Ankara, Turkey, and a PhD in applied physics from the University of Arkansas at Little Rock.
Yumei Tang ([email protected]) is a scientist in Halliburton's electromagnetics group where she is involved with LWD resistivity interpretation and modeling support. She holds a PhD in electrical engineering from the University of Houston.
Burkay Donderici ([email protected]) leads Hallibutrton's electromagnetics sensor physics team. He holds a PhD in electrical and computer engineering from Ohio State University, Columbus.


