Mark J. Kaiser
Louisiana State University
Baton Rouge
Mingming Liu
China University of Petroleum
Bejing
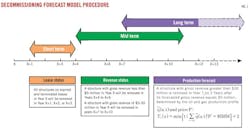
This final installment of our four-part series examining end-of-life production in the deepwater Gulf of Mexico (GOM) applies three forecast models to infer expected short, medium, and long-term decommissioning schedules for all GOM structures that sit in water deeper than 400 ft (Fig. 1).
Previously, we looked at deepwater decommissioning activity (OGJ, Feb. 3, 2014, p. 60), GOM well and structure inventories (OGJ, Mar. 3, 2014, p. 76), and the revenue and lease status of structures (OGJ, Apr. 7, 2014 p. 92).
Lease status is used to infer decommissioning activity over the next 3 years. Gross-revenue thresholds are used to estimate decommissioning activity across a 4-10 year horizon. Production forecasts predict the economic limits for structures currently generating more than $30 million that are not expected to be decommissioned in the near future.
Short-term forecast
Lease status is the most reliable way to determine short-term decommissioning requirements. Lease terms and regulatory requirements dictate well abandonment and structure removal by a specific time after lease termination or the cessation of production (Fig. 2).
Extenuating circumstances, such as economic utility and hub status, may delay decommissioning beyond the model-predicted estimates. Therefore, lease status serves as a proxy for short-term decommissioning activity.
On expired, terminated, and relinquished leases, operators must permanently plug all wells and decommission all structures on the lease within 1 year. Therefore, all structures on expired, terminated, and relinquished leases in Year X are required to be decommissioned by Year X+1.
In practice, timing differences, permitting delays, and other circumstances act to delay decommissioning beyond the predicted regulatory time frame. If structures on terminated leases are not removed in Year X+1, they usually will be removed in the Year X+2. In exceptional situations, for example if the structure was destroyed by a hurricane, it may remain in place for several years before decommissioning is completed.
Most structures on expired, terminated, and relinquished leases will be removed within 2 years of the lease terminating. For structures that stop production on active leases and are no longer economically viable or serve a useful function, regulations specify a 5-year timeline for removal after the structure is no longer useful.
According to the January 2013 deepwater lease inventory of expired, terminated, and relinquished leases, five structures in 400-500 ft of water did not produce in 2012 and two of these structures are expected to be decommissioned by yearend 2015.
Taylor Energy Co.'s MC-20 structure No. 23051 will not be removed until all well-abandonment work is complete, which will likely take several more years. The Manta Ray Offshore Gathering LLC and Poseidon Oil Pipeline Co. platform Nos. 23212 and 23353 serve as transportation hubs and will be removed when they no longer serve a useful purpose.
Five fixed platforms in water deeper than 500 ft and one floating structure that did not produce in 2012 will be removed before yearend 2015. In total, eight structures in waters deeper than 400 ft are to be decommissioned through 2015 (Table 1).
Medium-term forecast
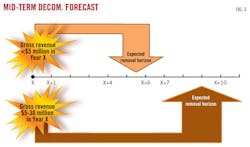
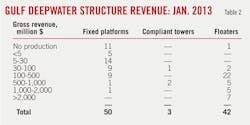
For producing structures, gross-revenue thresholds are useful to infer when an asset is no longer economic (Fig. 3). Structures that generated less than $5 million in 2012 are expected to be decommissioned in the 2016-18 time frame (Table 2). Structures that generated $5-30 million in 2012 are approaching their economic limit and are to be decommissioned during 2019-23.
If the gross revenue of a structure is $5 million or less, the structure is likely already a marginal producer or will approach its economic limit quickly. Structures with gross revenue of less than $5 million are likely to be removed in 4-6 years.
Structures generating $5-30 million will be removed 7-10 years from when they first generated $30 million, if they are far enough along their decline curve and no sidetrack or tieback opportunities exist in their futures.
Structure removals frequently are delayed as operators seek additional reserves and alternative uses for their assets. Capital expenditures may be successful in restoring or maintaining production, and again, therefore, gross revenue thresholds at best serve as a proxy of expected future activity. Deepwater structures are likely to have future utility as processing or transportation hubs.
Structures that produce from complex reservoirs or in prospective areas also have greater opportunity for sidetracks and potential future tiebacks. Rapidly declining structures, structures held by marginal wells, and operator preference for reducing asset-retirement obligations will lead to earlier-than-predicted removals.
Structures expected to be decommissioned but not removed in 2013-15 enter the 2016-18 time frame. Structures expected to be decommissioned that are not in 2016-18 enter the 2019-23 activity window. Conversely, structures that are decommissioned earlier than described by the forecast models reduce decommissioning counts later.
Based on their revenue thresholds, two structures in 400-500 ft of water are to be decommissioned during 2016-18 and as many as nine structures are expected to be decommissioned during 2019-23 (Table 1).
Three structures in more than 500 ft of water are to be decommissioned in 2016-18, and as many as five structures in 2019-23. No floating structures generated less than $30 million in gross revenue in 2012 and none is expected to be decommissioned during 2016-23.
Long-term forecast
Production modeling is the most reliable long-term decommissioning forecast for commercial producers. Uncertainties increase, however, as time horizons expand and forecast reliability declines. Deepwater structures, especially floaters, should maintain residual value and provide opportunities for developing marginal fields from subsea tiebacks and as pipeline junction stations.
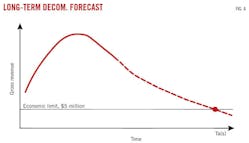
The expected decommissioning time for structures that generate more than $30 million is estimated by intersecting the structure's gross revenue forecast with the economic limit threshold (Fig. 4).
Two primary assumptions are made in structure production forecasts. First, capital expenditures will not be spent to drill new wells beyond the inventory of wells that currently exist. Second, operating conditions and the hub status of the structure will not change relative to conditions at the time of evaluation. Any departure from these conditions will alter the model-predicted results.
Production models are based on individual wells and summed at the structure level. Well inventories were fixed as of January 2013, and structures were classified according to their primary product streams. For oil structures, gas price is assumed constant at $4/Mcf in all price scenarios. For gas structures, oil price is assumed constant at $80/bbl in all gas price scenarios.
The production forecast for each structure generating more than $30 million is determined from the aggregate production forecast per individual well terminating at an assumed economic limit of $750,000/wellbore or $5 million/structure, whichever comes first. Oil and gas prices vary between $60-120/bbl and $2-8/Mcf. Structures are assumed to be decommissioned 2 years after their economic limit is reached. (Fig. 5)
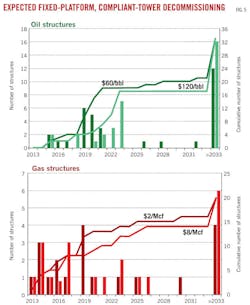
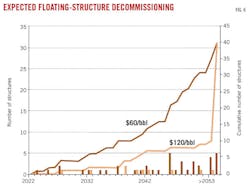
By 2023, a total of 26 fixed platforms and 1 floating structure likely will be decommissioned, representing more than half of the fixed platform inventory. From 2024-33, 5 fixed platforms and 5 floaters are expected to be decommissioned. After 2033, 18 fixed platforms and 36 floaters likely will be decommissioned (Fig. 6).
The timing of floater removals is subject to greater uncertainty relative to shallow-water structures because of the high residual value of the assets. As oil and gas prices increase, gross revenue increases, and the economic limit is delayed. This pushes back decommissioning and shifts the cumulative activity curves to the right.
Gas structures are more vulnerable to removal than oil structures because of lower prices and low-density infrastructure that may not allow economic transport for gas-lift operations.
For floaters, the bulk of decommissioning occurs in the future and over a much longer period of time. At $60/bbl oil, the model estimates the removal of 10 floaters by 2032. At $120/bbl, it will be 2042 before the first 10 floaters are decommissioned. Actual decommissioning activity likely will fall between these boundary conditions, and will be driven by future market and geologic conditions.
