US OLEFINS FIRST-HALF 2013: Ethylene production prospects clouded by first-half turnarounds
Dan Lippe
Petral Consulting Co.
Houston
US ethylene producers in both first and second quarters 2013 improved on the results of second-half 2012 and maintained output above the historic mid-range of 145 million lb/day. A heavy turnaround schedule, however, led to more capacity being out of service in second-quarter 2013 than in the first quarter.
Even though production curtailments from all causes in second-quarter 2013 were 68% more than in the first quarter, producers maintained production rates equal to the historic mid-range. The increase in production capacity during first-half 2013 was one of the factors that enabled the ethylene industry to limit the decline in production during the second quarter.
As ethylene producers increased cost-advantaged ethylene production, exports of high-density polyethylene (HDPE), low-density polyethylene (LDPE), and linear low-density polyethylene (LLDPE) for first-quarter 2013 were 21.5 million lb/day and were 3.62 million lb/day (20.2%) more than in first-quarter 2012 (https://usatrade.census.gov).
As US ethylene producers continue to increase capacity based on cost-advantaged light feeds, ethylene prices (especially net transaction prices) will continue to decline.
Petral Consulting Co. expects declining ethylene prices will result in lower prices for polyethylene and will support growth in polyethylene exports in the next 5-10 years. US ethylene producers have already begun to take advantage of their cost advantage.
Net transaction prices for ethylene were 45-50¢/lb in both first and second quarters 2013. In 2013, US companies will produce 90% of ethylene from feedstocks with cash costs of 10-15¢/lb.
From this perspective, US ethylene producers already have flexibility to reduce net transaction prices as they expand ethylene production and increase exports of polyethylene and other derivatives.
Petral Consulting surveys ethylene producers monthly to determine industry operating rates and demand for fresh feed. All volumes presented in the following discussion of olefin plant feedstock trends and a later discussion of ethylene production trends are based on results of this survey.
Feedslate trends
Ethylene industry demand for fresh feed reached 1.66 million b/d in first-quarter 2013 but declined to 1.58 million b/d in the second quarter. Demand for fresh feed in first-quarter 2013 was 108,600 b/d (7%) more than in first-quarter 2012. Demand in second-quarter 2013 was 76,200 b/d (5%) more than in second-quarter 2012.
Demand for LPG feeds (ethane, propane, and normal butane) averaged 1.47 million b/d in first-quarter 2013 but declined to 1.42 million b/d in the following quarter. Demand for LPG feed in first-quarter 2013 was 137,300 b/d (10.3%) more than in first-quarter 2012. Demand for LPG feed in second-quarter 2013 was 103,400 b/d (7.9%) more than in second-quarter 2012.
LPG feeds accounted for 88% of fresh feed in first-quarter 2013 and 90% in the second quarter. LPG feed demand as a share of total fresh feed hit a record high in second-quarter 2013. For 2005-07, LPG feeds accounted for 70% total fresh feed.
Economics for ethane vs. heavy feeds remained consistently favorable during first-half 2013. Downtime for planned turnarounds and unplanned downtime, however, temporarily stalled the steady increase in ethylene produced from ethane.
Ethylene producers continued to increase their use of ethane and further reduced their use of heavy feeds in first-quarter 2013, but ethane demand dropped in the following quarter, a drop similar in magnitude to the decline in second-quarter 2012.
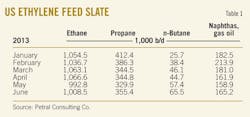
Ethane's share of total fresh feed was 63.3% in first quarter and 64.6% in second-quarter 2013 vs. 65.2% in second-half 2012. Table 1 summarizes trends in olefin plant fresh feed.
Petral Consulting forecasts that production from US ethylene plants will improve in second-half 2013 and the industry will operate at 84-88% of nameplate capacity during the period.
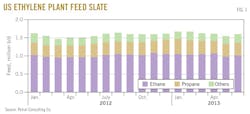
Petral Consulting also forecasts that demand for fresh feed will average 1.55-1.65 million b/d during third and fourth quarters 2013. Based on this forecast, demand for LPG feeds will average 1.45-1.50 million b/d during those 6 months. Fig. 1 shows historic trends in ethylene feed.
US ethylene production
Ethylene production averaged 151.4 million lb/day in first-quarter 2013 and 144.9 million lb/day in the following quarter. Ethylene production had not averaged 150.0 million lb/day since second-quarter 2007. Production in second-quarter 2013 was equal to the 3-year average.
Ethylene production in first-quarter 2013 was 109 million lb (7%) more than in first-quarter 2012; production in second-quarter 2013 was 76 million lb (5.1%) more than in second-quarter 2012.
Ethylene producers had a very light turnaround schedule in first-quarter 2013. Scheduled turnarounds took 1.6 billion lb/year (2.6% of nameplate capacity) out of service in first-quarter 2013. The volume of capacity out of service for scheduled turnarounds in second-quarter 2013 jumped to 5 billion lb/year (8.2% of nameplate capacity).
In first-quarter 2013, Petral Consulting estimates, scheduled turnarounds in first-quarter 2013 resulted in 3.5 million lb/day of lost production. Unplanned outages in those 3 months resulted in estimated additional production losses of 5.9 million lb/day. In second-quarter 2013, Petral Consulting estimates, scheduled turnarounds resulted in 12.1 million lb/day of lost production. Ethylene producers experienced fewer unplanned outages, and Petral Consulting estimates production losses were 3.6 million lb/day in that period.
Ethylene producers were able to offset about half of second-quarter production losses by operating some plants at 100% or more of nameplate capacity. In first-quarter 2013, producers operated 18.8% of nameplate capacity at 100% or more. In the second quarter, producers operated 20% of capacity at 100% or more.
Since 2007, US petrochemical companies greatly increased production from cost-advantaged feeds and completed various retrofits to increase light cracking capabilities in their multifeed plants. These developments began to blur the distinction between LPG plants and multifeed plants in 2010.
Before 2010, ethylene produced from ethane consumed in LPG plants was always more than half of total ethylene produced from ethane. In 2010, ethylene from ethane in LPG plants was slightly less than from ethane in multifeed plants and ethane consumed in multifeed plants accounted for 54% of total ethylene produced from ethane.
This shift continued in first and second quarters 2013, and ethane consumed in multifeed plants accounted for 60% of total ethylene produced from ethane. To be consistent with this change, Petral Consulting changed the focus of this article series to emphasize production of ethylene from light feed vs. heavy feeds rather than to distinguish ethylene production from LPG plants vs. multifeed plants.
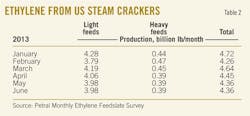
Since light feeds now account for more than 90% of US ethylene production, ethylene producers are near the limit of increasing light-feed demand capability for existing facilities. Ethylene production based on light feeds (ethane, propane, and normal butane) averaged 136.3 million lb/day in the first quarter this year but declined in the second quarter to 132.1 million lb/day.
Production from light feeds in first-quarter 2013 was 369 million lb (4.2%) more than in first-quarter 2012. Production from light feeds in second-quarter 2013 was 476 million lb (5.5%) more than in second-quarter 2012.
Ethylene production from heavy feeds was 15.1 million lb/day in first-quarter 2013 and declined to 12.8 million lb/day in the following quarter. Production from heavy feeds in first-quarter 2013 was 173 million lb (11.3%) less than in first-quarter 2012. Production in second-quarter 2013 was 183 million lb (13.6%) less than in second-quarter 2012.
Table 2 summarizes trends in ethylene production.
As long as variable production costs based on ethane and propane remain less than costs based on light naphtha and other heavy feeds, ethylene producers will continue to maximize ethylene production from light feeds and minimize the use of heavy feeds.
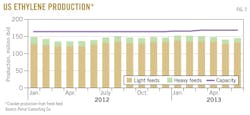
Fig. 2 shows trends in ethylene production.
US propylene production
Coproduct propylene supply depends primarily on feedstocks with a large propylene yield (propane, normal butane, naphtha, and gas oil feedstocks).
Petral Consulting's monthly survey of ethylene producers showed demand in first-quarter 2013 was 381,100 b/d for propane, 36,700 b/d for normal butane, and 192,500 b/d for heavy feeds. In the following quarter, demand was 343,400 b/d for propane, 55,900 b/d for normal butane and 162,000 b/d for heavy feeds.
Total demand for feeds with high propylene yield was 610,300 b/d in first-quarter 2013 and was 49,000 b/d (8.7%) more than in first-quarter 2012. Total demand for these feeds in second-quarter 2013 was 561,200 b/d and was 20,200 b/d (3.7%) more than in second-quarter 2012.
The increase in the use of these feedstocks suggests coproduct supply in first-half 2013 was more than in first-half 2012. Coproduct propylene yields, however, vary within the overall category of feeds with high propylene yields. Specifically, demand for propane increased in both first and second quarters 2013, but demand for natural gasoline and Algerian condensate declined in the same quarters. These variations contributed to an unexpected year-to-year difference in coproduct propylene supply vs. first-half 2012.
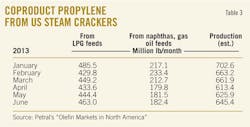
Coproduct supply (based on estimates derived from the monthly production and feedstock survey) increased in first-quarter 2013 but declined in the second quarter. Production averaged 22.6 million lb/day in first-quarter 2013 and 20.7 million lb/day in the second quarter.
Coproduct supply for first-quarter 2013 was 81 million lb (4.2%) more than in first-quarter 2012. Coproduct supply in second-quarter 2013 was the same as in second-quarter 2012.
Propylene production from light feeds averaged 15.2 million lb/day in first-quarter 2013 and 14.7 million lb/day in the second quarter. Production from light feeds in first-quarter 2013 was 194 million lb (16.6%) more than in first-quarter 2012. Production from light feeds in second-quarter 2013 was 88 million lb (7.0%) more than in second-quarter 2012.
The year-to-year increase in propane demand was the key for year-to-year increases in coproduct propylene supply from light feeds. Demand for propane in first-quarter 2013 was 62,200 b/d (19.5%) more than in first-quarter 2012. Demand for propane in second-quarter 2013 was 10,500 b/d (3.2%) more than in second-quarter 2012.
Propylene production from heavy feeds declined in both first and second quarters 2013 vs. year-earlier volumes. Coproduct propylene from heavy feeds was 7.4 million lb/day in first-quarter 2013 and 6 million lb/day in the second quarter.
Production from heavy feeds in first-quarter 2013 was 113 million lb (14.5%) less than in first-quarter 2012. Production from heavy feeds in second-quarter 2013 was 90 million lb (14.1%) less than in second-quarter 2012.
Table 3 summarizes trends in coproduct propylene supply.
PDH plant, refineries
According to PetroChem Wire, Petrologistics's propane dehydrogenation plant on the Houston Ship Channel experienced major maintenance-related downtime in January, April, and June of this year.
As a result, Petral Consulting estimates the plant produced 2.65-2.75 million lb/day in first-quarter 2013 and 2.35-2.45 million lb/day in the second quarter. Production in first-half 2013 was about 1.3 million lb/day (33.0%) less than in first-half 2012.
Refinery propylene sales into the merchant market are a function of feed rates in fluid catalytic cracking units (FCCU), operating severity in FCCUs, and economic incentives to sell propylene rather than use it as alkylate feed. Variations in FCCU feed rates are the most important parameter, while economic factors are generally of secondary importance.
Statistics from the US Energy Information Administration (EIA; www.eia.gov) show FCCU feed rates averaged 4.54 million b/d in first-quarter 2013 and increased to 4.9 million b/d in the following quarter. FCCU feed rates in first-quarter 2013 were 24,700 b/d (0.5%) less than in first-quarter 2012; feed rates in second-quarter 2013 were 164,500 b/d (3.3%) less than in second-quarter 2012.
FCCU feed rates in Petroleum Administration for Defense Districts (PADDs) 2 and 3 are more important than broader US trends because refineries in these two regions usually account for 90-95% of refinery-grade propylene. (See accompanying box for PADD regions.)
FCCU feed rates in PADDs 2 and 3 in first-quarter 2013 were 64,000 b/d (1.9%) more than in first-quarter 2012. FCCU feed rates in PADDs 2 and 3 in second-quarter 2013 were 137,000 b/d (3.7%) less than in second-quarter 2012. FCCU feed rates in PADDs 2 and 3 were 31.8% of crude runs in first-quarter 2013 and 31.5% of crude runs in the second quarter.
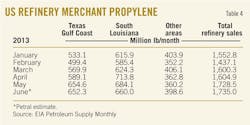
According to EIA statistics, refinery-grade propylene production was 51 million lb/day in first-quarter 2013 and 53.9 million lb/day in the following quarter. Production in first-quarter 2013 was 191 million lb (4.3%) more than in first-quarter 2012. Production in second-quarter 2013 was 92 million lb (1.8%) less than in second-quarter 2012 (Table 4).
Based on EIA statistics for refinery-grade propylene and Petral Consulting's estimates for coproduct supply, total US propylene supply increased in first-quarter 2013, averaging 73.6 million lb/day. Production was 3.9 million lb/day (5.6%) more than in first-quarter 2012.
US propylene supply increased again in second-quarter 2013, averaging 74.6 million lb/day. Although production in second-quarter 2013 was more than in first quarter, it was 1 million lb/day (1.4%) less than in second-quarter 2012.
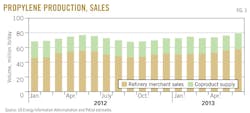
Fig. 3 presents trends in coproduct and refinery-propylene sales, as reported by EIA.
Ethylene economics, pricing
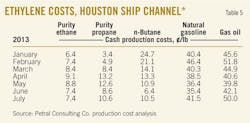
Production costs for ethylene on the Houston Ship Channel (assuming full spot prices for all coproducts) based on purity ethane feeds were 7-9¢/lb in the first two quarters of 2013. Production costs based on ethane for first-quarter 2013 were 1.4¢/lb less than in fourth-quarter 2012 and were 11-12¢/lb lower than in first-quarter 2012.
Production costs based on purity ethane were 8-9¢/lb in March, April, and May but were 7-8¢/lb in June and July. The uptick in production costs in April and May boosted the average for second-quarter 2013 to 8.0-8.5¢/lb. Variable production costs for purity ethane in second-quarter 2013 were only 4-5¢/lb less than in second-quarter 2012.
In first-quarter 2013, purity ethane provided ethylene producers with cost savings of 35¢/lb vs. natural gasoline. The cost advantage for ethane vs. natural gasoline in first-quarter 2013 was 7-8¢/lb more than in first-quarter 2012 but was about the same as in fourth-quarter 2012.
In second-quarter 2013, purity ethane provided a cost savings of 28-29¢/lb vs. natural gasoline. The cost savings declined in second-quarter 2013 because production costs for natural gasoline prices fell.
For a plant with a capacity of 1 billion lb/year based on natural gasoline and similar light naphtha, as in second-half 2012, the cost savings in first-half 2013 was again about $150 million. Ethane's cost advantage compared with natural gasoline and similar light naphtha continues to support retrofit projects of existing naphtha-based capacity and further expansion of US ethylene production capacity based on ethane as the primary feed.
As propylene prices surged in first-quarter 2013 and propane prices remained weak, production costs for purity propane fell to only 5-6¢/lb in first-quarter 2013 and were only 3-5¢/lb in January and February. Production costs based on propane were 6-7¢/lb less than in fourth-quarter 2013 and 17-18¢/lb less than in first-quarter 2012.
As coproduct credits declined and propane prices rose, however, production costs based on propane rebounded to 11-12¢/lb in second-quarter 2013. Production costs in the first quarter were 6-7¢/lb lower than in fourth-quarter 2012 and 17-18¢/lb lower than in first-quarter 2012.
In first-quarter 2013, variable production costs for propane were 2-3¢/lb less than ethane in January and February, but production costs based on propane were in parity with ethane in March. Propane's cost advantage compared with natural gasoline widened to 36-37¢/lb vs. 30¢/lb in fourth-quarter 2012.
In second-quarter 2013, variable production costs for propane were about 3¢/lb more than for ethane, but propane continued to provide cost savings of 30¢/lb vs. natural gasoline.
In first-quarter 2013, variable production costs for natural gasoline were unchanged compared with fourth-quarter 2012, averaging 42-43¢/lb. Production costs for natural gasoline in first-quarter 2013 were 3¢/lb less than in first-quarter 2012. Production costs for natural gasoline in second-quarter 2013 fell to 36-37¢/lb and were about the same as in second-quarter 2012.
Table 5 summarizes trends in ethylene production costs.
Ethylene pricing, profit margins
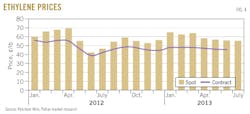
Spot prices for ethylene increased 10¢/lb vs. fourth-quarter 2012 and were 64¢/lb in first-quarter 2013. Spot prices declined in the second quarter, however, and were 57¢/lb, according to PetroChem Wire (www.petrochemwire.com). The contract benchmark increased to 48¢/lb in first-quarter 2013 and declined to 46¢/lb in the second quarter.
The spot market price premium compared with the contract benchmark increased to 16¢/lb in first-quarter 2013 but narrowed to 11¢/lb in the following quarter. Before 2011, spot prices were typically discounted compared with the contract benchmark.
Margins based on contract benchmark prices were steady and strong for ethane and propane in first and second quarters 2013, but margins for natural gasoline, light naphtha, and gas oil were weak.
Margins based for purity ethane were 36-38¢/lb in first-quarter 2013 and 33-35¢/lb in second quarter. Margins for propane were 35-40¢/lb in first-quarter 2013 but narrowed to 29-33¢/lb in second quarter. Margins based on natural gasoline were 0-3¢/lb in first-quarter 2013 and 3-5¢/lb in the second quarter.
Fig. 4 shows trends in ethylene prices (spot prices and net transaction prices); Fig. 5 shows profit margins based on spot ethylene prices and variable production costs.
Propylene pricing
According to EIA statistics, propylene inventory in Gulf Coast storage averaged 587 million lb in first-quarter 2013 and were 254 million lb (30.2%) less than in first-quarter 2012 but 69 million lb (13.2%) more than the 2009-11 average.
The reduction in the refinery-grade propylene inventory surplus was enough to spark a strong rally in spot prices during first-quarter 2013. refinery-grade propylene spot prices increased to 65.5¢/lb in first-quarter 2013 vs. 48¢/lb in fourth-quarter 2012. The rally pushed refinery-grade propylene spot prices to a premium of 19.3¢/lb vs. spot prices for unleaded regular gasoline.
| Feedstock prices, coproduct values, and ethylene plant yields determine ethylene production costs. Petral Consulting maintains direct contact with the olefin industry and tracks historic trends in spot prices for ethylene and propylene. We use a variety of sources to track trends in feedstock prices. Some ethylene plants have the necessary process units to convert all coproducts to purity streams. Some ethylene plants, however, do not have the capability to upgrade mixed or crude streams of various coproducts and sell some or all their coproducts at discounted prices. We evaluate ethylene production costs in this article based on all coproducts valued at spot prices. |
EIA statistics, however, showed propylene inventory in Gulf Coast storage increased about 50 million lb in second-quarter 2013, and the surplus increased to about 120 million lb vs. the 2009-11 average.
As the inventory surplus increased, refinery-grade propylene spot prices fell to 50-53¢/lb in April and May but rallied to 56-57¢/lb in June, according to PetroChem Wire. The pricing premium for refinery-grade propylene vs. unleaded regular gasoline also narrowed to 8.4¢/lb in second-quarter 2013.
In first-quarter 2013, the contract benchmark polymer-grade propylene increased to 75¢/lb and was 19¢/lb more than the average for fourth-quarter 2012. As refinery-grade propylene spot prices began to fall in second-quarter 2013, the contract benchmark for polymer-grade propylene also declined and was to 63.3¢/lb in the quarter.
Premiums for polymer-grade propylene contract benchmark prices vs. spot refinery-grade propylene prices were stronger in first and second quarters 2013 than in fourth-quarter 2012. Premiums averaged 9.5¢/lb in first-quarter 2013 and 9.8¢/lb in second quarter.
Second-half 2013 outlook
For second-half 2013, Petral Consulting forecasts crude oil production in North America will continue to grow at about the same rate as in first-half 2013. In first-quarter 2013, US crude oil production was 7.1 million b/d, and EIA's preliminary estimates for the second quarter show production increased to 7.2 million b/d.
Production in first-quarter 2013 was 936,000 b/d more than in first-quarter 2012. Production in second-quarter 2013 was 1.0-1.1 million b/d more than in second-quarter 2012.
Based on EIA statistics for global crude oil production, year-to-year growth in crude oil production in North America (US and Canada) was 1.23 million b/d. Globally, according to EIA statistics, crude oil production (excluding NGLs and other oils) in first-quarter 2013 was 75.5 million b/d and was only 0.27 million b/d less than in 2012.
Two factors offset production growth in North America. First, the European Union's embargo on Iranian crude oil continued to limit Iranian crude production (0.6 million b/d less than in first-quarter 2012). Second, Saudi Arabia held crude oil production constant at 9.14 million b/d (0.83 million b/d less than in first-quarter 2012).
US production, however, will continue to increase during second-half 2013, and the need for imports will continue to decline. Petral Consulting, however, expects crude oil buyers and traders also to continue to focus on changes in crude oil production in Saudi Arabia and short-term disruptions such as strikes at key export facilities in Libya during May, June, and July.
Furthermore, Petral Consulting's crude oil price forecast assumes that Saudi Arabia will continue to reduce production as necessary to sustain crude oil prices higher than $100/bbl. Petral Consulting forecasts spot prices for dated Brent will average $105-115/bbl in third and fourth quarters 2013.
More importantly for ethylene production costs on the US Gulf Coast, however, trends in supply-demand balances for ethane and propane point to stronger prices for these two ethylene feedstocks in the third and fourth quarters.
First, ethane prices have been too weak to support full-recovery operations for many gas plants in the Rocky Mountains and Midcontinent since second-quarter 2012. The reduction in gas plant ethane production contributed to a decline of 4.6 million bbl in inventory in Gulf Coast storage Dec. 1, 2012, through Apr. 1, 2013. These gas plants will continue to limit ethane production until prices increase to 30-35¢/gal.
Second, propane inventory in Gulf Coast storage on Apr. 1 was 11.2 million bbl more than the 3-year average. When Enterprise Products Partners LP began operations at its expanded LPG export terminal in March (OGJ Online, Mar. 7, 2013), EIA statistics showed waterborne propane exports jumped to 250,000-280,000 b/d in April and May, and Petral Consulting forecasts waterborne exports to increase to 300,000-350,000 b/d in September or October when Targa Resources completes the second major LPG export terminal project (OGJ, May 7, 2012, p. 104; OGJ Online, Aug. 1, 2013).
According to EIA statistics, US propane exports in March and April this year were 135,000 b/d and 91,000 b/d more than in the same months, respectively, in 2012. The increase in propane exports immediately affected the inventory surplus in Gulf Coast storage. On May 1, inventory was only 6.2 million bbl more than the 3-year average. The increase in waterborne propane exports and ethane rejection will result in less availability for both feedstocks.
As a result, Petral Consulting forecasts spot prices for both ethane and propane will increase in third and fourth quarters 2013.
Based on rising feedstock prices, Petral forecasts variable ethylene production costs based on ethane will average 8-9¢/lb in third-quarter 2013 but will increase to 10-12¢/lb in the fourth quarter. Petral forecasts variable production costs based on propane will increase to 13-14¢/lb in the third quarter and 20-24¢/lb in the fourth quarter.
Natural gasoline and gas oil will remain the high-cost feedstocks for ethylene production, but Petral Consulting forecasts heavy feeds will account for less than 10% of US ethylene production in third and fourth quarters 2013. Spot ethylene prices, however, tend to track production costs for the high-cost source of supply. Petral forecasts production costs based on natural gasoline and gas oil will be 45-50¢/lb in the third quarter and 45-55¢/lb in the fourth quarter.
Based on variable costs plus fixed cash costs for gas oil and natural gasoline, Petral Consulting forecasts spot ethylene prices will average 55-57¢/lb in third-quarter 2013 but weaken in the fourth quarter and average 50-53¢/lb.
Petral Consulting forecasts premiums for spot prices vs. the benchmark net transaction price will average 8-12¢/lb in third-quarter 2013 but narrow to 5-8¢/lb in the fourth quarter. On this basis, net transaction prices will average 42-46¢/lb in third and fourth quarters.
Three factors strongly influence spot prices for refinery-grade propylene.
1. FCCU feed rates generally track the seasonal variation in refinery crude runs, and refinery-grade propylene supplies are usually at peak volumes in second and third quarters but decline in the fourth quarter. As refinery-grade propylene supplies increase, spot prices usually fall.
2. Spot prices for unleaded regular gasoline in the Gulf Coast pipeline market and octane values are also usually stronger in second and third quarters. The seasonal increase in gasoline prices and octane values sometimes offsets the seasonal weakness in spot prices. As refinery-grade propylene supply declines in fourth quarter, spot prices usually increase, but sometimes the seasonal tendency for prices to increase as supply declines does not occur until first quarter.
3. Trends in the aggregate supply-demand balance for polymer-grade propylene also influence refinery-grade propylene's prices. The trend in propylene inventory in Gulf Coast storage is the most direct and most easily measured variable that reflects the underlying supply-demand trend.
Petral Consulting forecasts spot prices for refinery-grade propylene to average 55-58¢/lb in third-quarter 2013 and 53-56¢/lb in the fourth quarter. Spot prices for refinery-grade propane in the second quarter were 8.4¢/lb more than spot prices for unleaded regular gasoline. Petral Consulting forecasts premium will remain steady and average 8-9¢/lb in third-quarter 2013.
Petral Consulting forecasts price premiums for refinery-grade propylene vs. unleaded regular gasoline prices will increase in fourth-quarter 2013 and average 9-10¢/lb.
After a 10¢/lb reduction in the contract benchmark price in April, polymer-grade propylene prices found traction and increased to 65¢/lb in June. The contract benchmark was unchanged in July. Petral Consulting forecasts contract benchmark will increase 1-3¢/lb in the fourth quarter due to the expected decline in coproduct supply.
The author
Daniel L. Lippe ([email protected]) is president of Petral Consulting Co., which he founded in 1988. He has expertise in economic analysis of a broad spectrum of petroleum products including crude oil and refined products, natural gas, natural gas liquids, other ethylene feedstocks, and primary petrochemicals.
Lippe began his professional career in 1974 with Diamond Shamrock Chemical Co., moved into professional consulting in 1979, and has served petroleum, midstream, and petrochemical industry clients since. He holds a BS (1974) in chemical engineering from Texas A&M University and an MBA (1981) from Houston Baptist University. He is an active member of the Gas Processors Suppliers Association and serves on GPA's NGL Market Information Committee.
