US Propane: C3 producers, wholesalers watch persistent surpluses on US Gulf Coast
Dan Lippe
Petral Consulting Co.
Houston
The most important concern for US propane producers and wholesalers going into any winter heating season—and the 2012-13 season was no exception—is the uncertain answer to two questions:
1. Will winter be cold enough to boost space-heating demand to normal levels?
2. Will we be able to sell production and accumulated inventory?
At the beginning of winter 2012, the inventory surplus and continued growth in gas plant propane supply aggravated these concerns.
Producers and wholesalers know there are only three ways to liquidate surplus inventory: Hope for colder winter and more space-heating demand in retail markets, more ethylene feedstock demand, and more waterborne exports.
Producers and wholesalers were also acutely aware that US ethylene producers continued to focus on increasing their ethane cracking capabilities. They were also acutely aware that the first major project to increase US propane export capacity in the Houston Ship Channel LPG export terminals would not be in service until near the end of winter 2012-13.
These producers and wholesalers concluded that propane markets in North America could only depend on colder weather or more ethylene feedstock demand further to reduce the inventory surplus during winter 2012.
Hence, once again, trends in price-value relationships between propane and ethane in the US Gulf Coast ethylene feedstock market were particularly important as a mechanism to resolve the persistent inventory surplus. Ethylene plants in Texas and Louisiana have the demonstrated capability to vary propane consumption within a range of 200,000-400,000 b/d. A swing of 50,000 b/d in ethylene feedstock demand translates into a cumulative increase in demand of 5 million bbl in 100 days (about 3 months).
NGL distribution system constraints were pervasive influences on NGL markets for the past few years, but midstream companies have aggressively expanded pipelines, fractionation capacity, and export capability. Short-lived pervasive distribution system constraints will come to end within the next 12 months. Although future winters may again be as mild as 2011, the expanded export capability gives the market an important new mechanism for resolving supply-demand imbalances.
Feedstock demand
Based on well-established seasonal trends, producers and wholesalers had reason to expect feedstock demand for propane to decline by 30,000-40,000 b/d in fourth-quarter 2012. Petral Consulting's survey results, however, show that demand for propane was 351,400 b/d in the quarter, 12,900 b/d more than in third-quarter 2012 and 44,000 b/d more than in fourth-quarter 2011.
The increase in feedstock demand in fourth-quarter 2012 was only 1.2 million bbl vs. third-quarter 2012, but demand was 4.1 million bbl more than in fourth-quarter 2011. The year-to-year increase in feedstock demand contributed largely to reducing the inventory surplus during fourth-quarter 2012.
Petral's survey results show demand continued to rise, reaching about 380,000-390,000 b/d in first-quarter 2013, 35,800 b/d (2.5 million bbl) more than in fourth-quarter 2012. During first-quarter 2013, feedstock demand reached a 5-year high of 412,000 b/d in January 2013, but demand fell to 350,000 b/d in March.
During 2006-10, propane's share of fresh feed for fourth and first quarters averaged 18-19%; the maximum was 21%. Propane's share of fresh feed was 22% in fourth-quarter 2012 compared with 21% in third-quarter 2012. Propane's share of fresh feed increased to 23.4% in first-quarter 2013 and was 24.6% in January.
In fourth-quarter 2012, propane was less expensive than all other feeds except ethane; production costs based on propane declined to parity vs. ethane in December 2012. Propane's share of fresh feed increased to 23.7% in December.
Propylene prices jumped sharply in January and February 2013, and propane was less expensive than all other feeds including ethane during January, February, and the first half of March.
When feedstock demand for propane reached a peak of 412,000 b/d in January, propane's share of fresh feed increased to 24.6%; propane's share of fresh feed had not been more than 24.5% in any month during 1996-2012.
The increase in feedstock demand for propane in first-quarter 2013 vs. first-quarter 2012 was 68,300 b/d, or 5.83 million bbl.
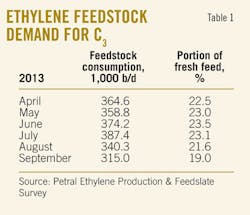
Table 1 summarizes trends in ethylene feedstock demand for propane. Petral Consulting estimates total demand for fresh feed averaged 1.60 million b/d in fourth-quarter 2012 and increased to 1.66 million b/d in first-quarter 2013.
We forecast total demand for fresh feed will average 1.60-1.65 million b/d in second and third quarters 2013. Until strong feedstock 2demand and an increase in waterborne exports deplete the inventory surplus, propane availability and economics will support feedstock demand at 330,000-350,000 b/d (20-21% of fresh feed) in second and third quarters 2013.
Fig. 1 shows historic trends in ethylene feedstock demand for propane
Retail demand
The first half of winter 2012 for key US regional markets was colder than the first half of winter 2011 but was again mild compared with 5-year averages.
In contrast, the second half of winter 2012 proved to be colder than the 5-year average and much colder than second half of winter 2011. Statistics published by US National Weather Service Climate Prediction Center (www.cpc.ncep.noaa.gov) showed the number of heating degree-days in fourth-quarter 2012 for the Northeast and Upper Midwest were 10-11% more than in fourth-quarter 2011 but were 4% less than the 5-year average.
In first-quarter 2013, statistics published by the center showed heating degree-days in the Northeast were 26% more than in first-quarter 2012 and were only 2% less than the 5-year average. Heating degree-days in the upper Midwest were 32% more than in first-quarter 2012 and were only 1% less than the 5-year average.
March 2013 proved to be much colder than the 5-year average and heating degree-days were 20-30% more than the 5-year average. March is almost always warmer than January and February, however, and the colder weather was not enough to make first-quarter 2013 colder than the 5-year average.
We estimate retail propane demand for fourth-quarter 2012 averaged 781,000 b/d; demand was 21,500 b/d (2.0 million bbl) more than in fourth-quarter 2011. The average for 2007-09 was 816,800 b/d. We estimate demand for first-quarter 2013 averaged 1,009,000 b/d and was 140,800 b/d (12.7 million bbl) more than in first-quarter 2012.
Propane wholesalers and retailers generally view March to be the last month of the winter heating season and April to be the first month of the off-season. We forecast retail demand will average 285,000-315,000 b/d in second-quarter 2013 and 175,000-185,000 b/d in third-quarter 2013.
Exports
Propane prices in international markets increased by 45-50¢/gal in fourth-quarter 2012, but prices in Mont Belvieu were unchanged vs. third-quarter 2012. As a result, discounts for product in Mont Belvieu storage vs. price benchmarks in international markets widened to 100-114¢/gal in fourth-quarter 2012 compared with 55-60¢/gal in third-quarter 2012.
Propane prices in international markets declined by 20-30¢/gal in first-quarter 2013, but prices in Mont Belvieu were only 2-3¢/gal less than in fourth-quarter 2012. Pricing discounts for propane in Mont Belvieu storage narrowed to 80-90¢/gal.
Until Enterprise Products Co. completed construction and started up the capacity expansion at its export terminal on the Houston Ship Channel (OGJ Online, Mar. 7, 2013), exports from Gulf Coast LPG terminals averaged 140,000-150,000 b/d and Petral deemed this range to be the maximum based on refrigeration capacity limits. As price discounts widened in fourth-quarter 2012, however, waterborne exports increased to higher sustained volumes.
Data from the US Energy Information Administration (EIA; www.eia.gov) and US Census Bureau's Foreign Trade Division (www.census.gov/foreign-trade) showed Gulf Coast exports averaged 189,500 b/d for fourth-quarter 2012; exports in November were 216,000 b/d. EIA and Census/Foreign Trade statistics show exports from Gulf Coast terminals were 141,800 b/d in January 2013 and 167,500 b/d in February 2013. We estimate exports increased to 225,000 b/d in March, resulting in estimated average exports for first-quarter 2013 at 175,000 b/d.
Total US exports (including overland shipments into Mexico) were 208,600 b/d in fourth-quarter 2012; these were 51,500 b/d more than in third-quarter 2012.
Propane exports in fourth-quarter 2012 were 105,000 b/d (9.6 million bbl) more than in fourth-quarter 2011. The year-to-year increase in exports helped offset the impact of relatively mild winter weather in fourth-quarter 2012. Exports, at full capacity rates of 250,000-260,000 b/d during second and third quarters 2013, will further reduce the US inventory surplus before winter 2013 begins.
When Targa Resources completes its export terminal expansion project (OGJ, May 7, 2012, p. 104), Gulf Coast LPG export terminals will have the capacity to accommodate propane exports at 320,000-330,000 b/d.
Editor's note: More on US LPG exports, resulting mainly from shale gas production, can be found in articles that comprise this week's Worldwide Gas Processing special report that begins on p. 74.
Propane supply
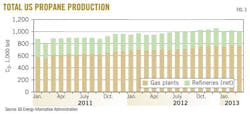
EIA data show total domestic production from gas plants and net propane production from refineries averaged 1.04 million b/d in fourth-quarter 2012, exceeding 1 million b/d for the first time.
Production in fourth-quarter 2012 was 95,000 b/d (8.7 million bbl) more than year-earlier volumes. Based on EIA data for January and February 2013 and Petral Consulting's estimates for March 2013, we estimate total domestic production at 1.01-1.012 million b/d in first-quarter 2013; this was 55,000-65,000 b/d (5.0-5.4 million bbl) more than year-earlier volumes.
Gas plants
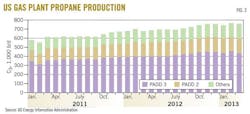
EIA statistics indicate that gas plant propane production averaged 751,600 b/d in fourth-quarter 2012. This was 93,000 b/d (8.6 million bbl) more than in fourth-quarter 2011 and accounted for nearly 100% of the year-to-year increase in domestic production.
Historically, gas plant production sometimes declines in first quarter vs. fourth quarter. And in fact, EIA statistics showed gas plant production in January 2013 at 15,000 b/d less than in December 2012, averaging 741,200 b/d but production in February increased to 764,500 b/d and was 8,300 b/d more than in December 2012. We estimate production was 745,000-755,000 b/d in first-quarter 2013 and was 65,000-68,000 b/d (about 5.4 million bbl) more than in first-quarter 2012.
Finally, Petral Consulting forecasts gas plant production to average 755,000-765,000 b/d in second and third quarters 2013.
Fig. 2 shows trends in propane production from gas plants.
Refineries
For fourth-quarter 2013, EIA statistics showed propane production from refineries (net of propylene for propylene chemicals markets) was 284,100 b/d; net production was only 5,050 b/d more than in third-quarter 2012 and was 2,000 b/d more than in fourth-quarter 2011.
For first-quarter 2013 (based on EIA statistics for January and February and Petral estimates for March 2013), net refinery propane production was 250,000-260,000 b/d. We forecast purity propane supply from refineries will average 280,000-290,000 b/d for second and third quarters 2013.
Fig. 3 shows trends in total propane production (gas plants and refineries).
Imports
Data published by the Census Bureau's Foreign Trade Division show imports at 123,300 b/d in fourth-quarter 2012 and 155,000 b/d (estimated) in first-quarter 2013. All imports were from Canada.
Imports in fourth-quarter 2012 were 17,800 b/d less than a year earlier. Imports in first-quarter 2013 were about 58,000 b/d more than a year earlier.
We forecast total imports into the US will average 65,000-75,000 b/d in second-quarter 2013 and 85,000-95,000 b/d in third-quarter 2013. We expect Canada again to account for all imports into US markets.
Inventory trends
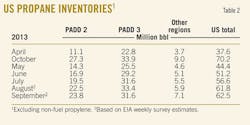
Propane inventory (excluding non-fuel propylene inventory included in EIA's gross propane-propylene inventory data) in primary storage in the US was 71.4 million bbl on Oct. 1, 2012. EIA statistics from the Petroleum Supply Monthly (PSM) showed inventory on Oct. 1 was 17.6 million bbl more than year-earlier volumes but was only 10.0 million bbl more than the 3-year average.
In the winter heating seasons of 2005-10 (fourth and first-quarter), inventory withdrawals were generally 35-45 million bbl but were only 20 million bbl in winter 2008. In winter 2011 withdrawals were only 16.5 million bbl.
Colder weather in first-quarter 2013 and year-to-year increases in ethylene feedstock demand and waterborne exports pushed withdrawals to 36-37 million bbl, according to EIA statistics in the Petroleum Supply Monthly (through February 2013) and weekly surveys for March 2013.
Inventory in US storage on Jan. 1, 2013, was 64.3 million bbl and was 10.1 million bbl more than year-earlier volumes and 17.4 million bbl more than the 3-year average. By Apr. 1, 2013, inventory fell to 35 million bbl and was 5.9 million bbl less than year-earlier volumes and only 6.7 million bbl more than the 3-year average. The comparison with the 3-year average and 2012 are both important indicators for off-season trends.
Inventory in Canada typically begins to decline in September and usually reaches its seasonal minimum on Mar. 1; occasionally, inventory continues to decline in March and reaches its seasonal minimum on Apr. 1. Canada's National Energy Board (NEB; www.neb-one.gc.ca) statistics showed inventory in Canadian storage reached its seasonal peak a month later than usual and was 13.6 million bbl on Oct. 1, 2012. NEB statistics show Canadian marketers liquidated 11.2 million bbl of inventory and inventory fell to a low of 2.5 million bbl on Apr. 1, 2013.
Typical withdrawals during previous winter heating seasons were 9.0-9.5 million bbl, but withdrawals during winter 2011 were only 5.9 million bbl. Withdrawals during November 2012 through February 2013 were 2.9 million bbl more than the 3-year average.
Table 2 lists US propane inventories for October 2012-April 2013; Fig. 4 shows trends in that storage.
Regional inventory trends
EIA statistics showed inventory in primary storage in Petroleum Administration for Defense District (PADD) 2 reached a peak of 27.9 million bbl on Oct. 1, 2012. Inventory on Oct. 1 was 3.6 million bbl more than year-earlier volumes but was only 0.74 million bbl more than the 3-year average. (See accompanying box for PADD regions.)
Inventory withdrawals during fourth-quarter 2012 were 5.9 million bbl and surged to 13.0 million bbl in first-quarter 2013. Withdrawals in fourth-quarter 2012 were 95% of the 3-year average, but withdrawals in first-quarter 2013 were 4.5 million bbl (153%) more than the 3-year average.
Based on EIA weekly survey data for February and March, we estimate inventory fell to a seasonal minimum of 9 million bbl on Apr. 1. At this level, inventory in PADD 2 storage was 1.5-2.0 million bbl less than the 3-year average and 8 million bbl (470%) less than in 2012.
The combined impact of more winter demand in the upper Midwest and more pipeline capacity to transfer surplus inventory to the Gulf Coast completely eliminated surplus inventory in the Midcontinent.
EIA statistics showed inventory in primary storage in PADD 3 (excluding non-fuel propylene) reached its seasonal maximum of 35 million bbl on Dec. 1 (2 months later than normal). Inventory on Dec. 1 was 9.7 million bbl more than the 3-year average and 13.8 million bbl more than in 2012.
Even though the inventory withdrawal season was 61 days shorter than normal (based on Oct. 1 as the typical date for peak inventory), EIA reports showed inventory fell to a low of 25.5-26.0 million bbl on Apr. 1, 2013. Inventory on Apr. 1, 2013, was about 5.7 million bbl more than in 2012 and was 9.5 million bbl more than the 3-year average.
Withdrawals from PADD 3 storage were 9.5 million bbl from Dec. 1, 2012, through Mar. 31, 2013. Withdrawals in previous winter heating seasons varied sharply during 2005-12. Withdrawals were 23-24 million bbl in 2005, 2006, and 2009, but withdrawals were only 9.2 million bbl in 2008 and 4.7 million bbl in 2011.
If the increase in waterborne exports and steady ethylene feedstock demand offset year-to-year growth in gas plant production, as expected, the seasonal inventory build in PADD 3 will be below average and the inventory surplus will disappear before the end of third-quarter 2013.
Pricing, economics
Spot prices for dated Brent averaged $109-112/bbl during fourth-quarter 2012 and increased to $116/bbl in February 2013. Dated Brent, however, dropped to $102/bbl in April 2013 and fell below $100/bbl for a week in mid-April. Spot prices for dated Brent had not been less than $100/bbl since June 2012.
In June 2012, discussions about Greece's future as a member of the European Union caused international crude oil traders to express concern about the future of the European Union. In April 2013, the Cyprus bailout crisis (and other concerns about general economic trends) revived anxiety about the future of the European Union.
The crisis came and went, however, and the European Union continued to limp forward. But international crude oil traders will continue to react to European economic and political news during 2013.
EIA statistics show Saudi Arabia reduced production in third and fourth quarters 2012. According to EIA statistics, production was 9.5 million b/d in fourth-quarter 2012 and fell to 9.2 million b/d in December 2012.
Production in fourth-quarter 2012 was 416,700 less than in third-quarter 2012 and was 213,300 b/d less than in 2011. Saudi Arabia production cuts in fourth-quarter 2012 offset about 73% of the growth in US production in fourth-quarter 2012.
Economic sanctions and the embargo on crude oil exports from Iran showed diminishing impact in fourth-quarter 2012. EIA statistics show Iran's crude oil production was 3.03 million b/d in fourth-quarter 2012 compared with 3.15 million b/d in third-quarter 2012.
The global supply-demand balance remained tight enough to limit any large decline in prices despite indications of weakness in global economic growth. Most likely, Iranian production and exports were nearly constant in first-quarter 2013 and will remain steady in second and third quarters 2013. This factor was a bullish consideration for crude oil prices in second-half 2012 but will be a neutral influence on prices in second and third quarters 2013.
Mild winter weather in the US limited the seasonal increase in retail demand and had a pronounced bearish impact on propane prices in fourth-quarter 2012. As producers and marketers became more concerned about winter season retail demand, spot prices in Mont Belvieu fell sharply after October.
Propane prices were 96¢/gal in October 2012 but dropped to 81¢/gal in December. Price ratios vs. dated Brent were 36.3% in October 2012 but fell to 31% in December 2012.
Ethylene production costs based on spot prices in Mont Belvieu were 17¢/lb in October 2012; variable production costs based on propane were 6.5¢/lb more than production costs based on ethane in October. In December 2012, variable ethylene production costs fell to 6.8 ¢/lb and were equal to variable costs based on ethane.
Ethylene producers had incentives to increase propane consumption of 24¢/lb vs. natural gasoline in October 2012 and incentives for propane increased to 35¢/lb in December 2012. These comparisons indicate propane prices were progressively weaker in fourth-quarter 2012.
In first-quarter 2013, colder weather and strong feedstock demand provided moderately bullish support prices for prices. Prices were 84¢/gal in January and 86¢/gal in February but ratios vs. dated Brent were unchanged compared with December 2012 and averaged 31%. Prices broke through the 90¢/gal barrier in mid-March and averaged 89.5¢/gal. Furthermore, the ratio to dated Brent increased to 35% in March.
Ethylene production costs based on propane were 3-5¢/lb in January and February and were 2-4¢/lb less than costs based on purity ethane. This shift shows propane prices (based on feedstock value relationships) were even weaker than in fourth-quarter 2012. When prices began to increase in March, variable ethylene production costs based on propane rose to 8-9¢/lb and were equal to costs based on purity ethane.
Even though winter weather was colder in first-quarter 2013, feedstock demand approached an historic high and waterborne exports increased; producers and wholesale marketers continued to focus on the bearish influence of surplus inventory in Gulf Coast storage.
Propane prices: spring, summer 2013
Until second-quarter 2013, bullish influences dominated international markets. Supply-demand trends within North America, however, are likely to be progressively more bearish for international crude oil prices, especially if US crude oil production continues to increase at 1 million b/d/year.
As US crude oil producers increased rail shipments of domestic crude oil production to East Coast and Gulf Coast refineries, EIA statistics show US imports of crude oil from West Africa declined 60%, to 0.39 million b/d for 2012-13 from 0.98 million b/d in 2010.
As US crude oil production continues to grow, imports into the US will decline further, and international crude oil exporters will increasingly compete for a shrinking customer base. This consideration is bearish for international crude oil prices during second and third quarters 2013.
Economic growth in China remains a source of concern for international crude oil traders. HSBC's Purchasing Managers Index (PMI; www.hsbc.com) points to weakening economic growth in China. The PMI for China increased to 51.6% in March 2013 but fell to 50.5% in April.
China is the one country the world depends upon for strong economic growth and increasing demand for refined products. If lackluster economic performance there continues in second and third quarters 2013, international crude oil traders will have one more major concern.
Finally, economic growth in Europe will remain at risk during 2013 as major powers in the European Union continue to look for solutions to the sovereign debt crisis. The continued economic and political turmoil in Europe has bearish implications for crude oil prices. We forecast dated Brent prices will average $95-105/bbl during second and third quarters 2013.
Supply-demand considerations for propane will become increasingly bullish during summer 2013. Specifically, the inventory build in PADD 3 will be below average due to the 100,000-b/d increase in waterborne exports compared with 2012. Additionally, feedstock demand will remain at average or above-average rates in second and third quarters 2013.
The increase in waterborne exports began to affect the seasonal build in early April. EIA's weekly statistics showed inventory in Gulf Coast storage declined by 2.2 million bbl during the first 3 weeks of April 2013. The 3-year average showed an increase of 0.85 million bbl.
In the Gulf Coast ethylene feedstock markets, ethane prices are also poised for recovery. As they increase, propane's feedstock parity values will rise, and this trend will reinforce bullish pressures on propane prices during second and third quarters 2013. We forecast spot prices in Mont Belvieu will average 95-100¢/gal in second-quarter 2013 and 100-110¢/gal in third-quarter 2013.
The author
Daniel L. Lippe ([email protected]) is president of Petral Consulting Co., which he founded in 1988. He has expertise in economic analysis of a broad spectrum of petroleum products including crude oil and refined products, natural gas, natural gas liquids, other ethylene feedstocks, and primary petrochemicals.
Lippe began his professional career in 1974 with Diamond Shamrock Chemical Co., moved into professional consulting in 1979, and has served petroleum, midstream, and petrochemical industry clients since. He holds a BS (1974) in chemical engineering from Texas A&M University and an MBA (1981) from Houston Baptist University. He is an active member of the Gas Processors Suppliers Association and serves on GPA's NGL Market Information Committee.

