Algeria applies dynamic performance estimate to pipeline system rehab
Karim Younsi
Ammar Chebouba
Nordine Zemmour
University of Boumerdes
Boumerdes, Algeria
Abdelnacer Smati
Pegaz Engineering
Algiers
New methods of dynamically estimating complex natural gas systems performance can prove useful not only in design and operations, but also in planning for rehabilitation and expansion.
Algeria has a complex network of natural gas pipelines moving production to national and international customers. Its pipeline operators have proposed an ambitious program of rehabilitation and expansion. The very high costs of such programs, due mainly to network complexity, required development of tools to locate bottlenecks in advance and eliminate them as efficiently as possible.
After selecting a framework defining objectives, planners turned to developing a model that would allow them to quantify the impact of any decision on meeting these objectives. This article applies the concept of performability1-3 to this process.
For complex pipeline networks with numerous redundancies, the failure of any single element does not cause a total stop in operations but a decline in performance characterized by reduced flow. Work continues, even in the presence of failures. This kind of system is degradable and fault-tolerant. Its correct modeling must integrate reliability and performance in the same reference frame.
Degradable systems' operating assumptions include the ability to remain in service at various levels of performance. At system start-up, all components are assumed to be operational and the system will operate at maximum performance. When a component fails, the system will reconfigure itself and restart activities, albeit with degraded performance. The long interval typical between failures means the system will operate mostly in steady state between successive reconfigurations and failures.
Background
Performability is the association of a reliability model with a performance model. The first task is defining the mathematical nature of this association.
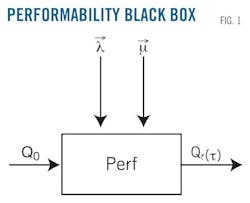
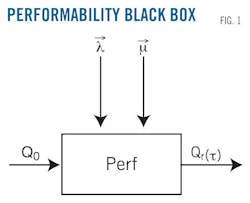
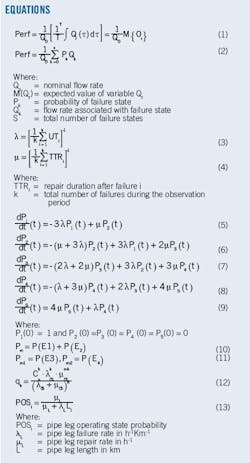
In a black box representation (Fig. 1) with the rated capacity of the system, Q0, an input variable and an output variable of real capacity, Qr, the system process is subject to two disturbance vectors: failure rates, →λ , and repair rates →μ . Rated capacity is the transport capacity of the network in absence of failures. Failure's random nature leads to random fluctuations in flow rate over time, τ (Equation 1). Statistical distribution can then model these fluctuations, or they can be assessed as random processes with discrete space-of-failure states (Equation 2).
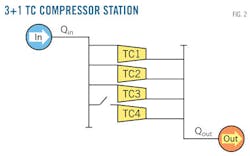
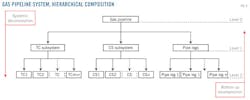
Natural gas pipelines generally encompass compressor stations (CS) and pipe legs. A compressor station includes several turbo-compressors (TC) installed, in most cases, on passive redundancy. Algerian gas compressor stations are generally configured with 3+1 TC installed in parallel on passive redundancy (Fig. 2).
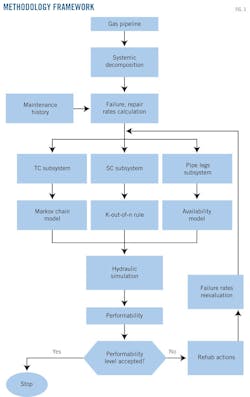
Fig. 3 shows the general approach used for this article, taking into account the following assumptions:
• Failure and repair rates are the same for all TC.
• Failure and repair rates are the same for all CS.
• Failure and repair rates, issued from databases, are constant for all pipe legs.
• Repairs start immediately after failures.
Systemic approach
For complex pipeline systems, the main drawbacks regarding Equation 2 are:
• The huge dimension of space, S.
• Difficulties related to defining probabilities for every state.
Complex pipeline systems therefore require a systemic approach to bring space, S, to manageable dimensions4-6 by splitting the global system into subsystems. Every subsystem can similarly split into lower level subsystems. A subsystem generally will be defined as an interacting collection of elements or lower level subsystems.
An element forms the basis of a subsystem that can't be broken down into further sub-elements. A hierarchical flow diagram having more or fewer high-level numbers depending on the degree of detail required from the modeling process illustrates this breakdown. This article uses a three-level hierarchy to model pipeline reliability (Fig. 4).
A bottom-up approach reconstitutes the global model. An element can be either operational or in a failure state. An element in good operating condition can be in operation or on standby. A combination of a subsystem's constituent elements might characterize its state. In the same manner, combining immediately lower subsystem states can define a high-level subsystem state.
Reliability rates
The basic reliability indexes of compression unit components are failure rates, TC, CS λTC, and λCS, and repair rates, μTC and μCS. The law of large numbers (LLN) provides the basis for the "frequentist approach"6-10 representing the classical identification of reliability indexes.
Equation 3 estimates the rate of failure for UT1, UT2,..., UTk as a sample of the random variable representing the up times of selected equipment. The same logic applies to the repair rate (Equation 4).
Failure modeling
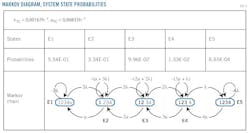
A compressor station consists of n operating and r standby TC. Each TC is in either a good operating state (OS) or failure state (FS). Different combinations of these elements determine finite set E, with C2n+r dimension, for all possible system states. A stochastic modeling process using Markov chain11-12 can evaluate probabilities of different E states. Circles on the Markov model represent the component states (working or failed), with arrows showing the direction of transition between states (failure or repair). Arrows with numeric values show failure or repair rates.
System states are a combination of different element states. A change in the condition of any element starts system transition from one state to another. The homogeneous Markovian process features constant transition rates with the following assumptions:
• Failure rates identical for m+r TC.
• Perfect standby element permutation.
• Immediate spare part availability.
• m+r repair teams.
Fig. 5 shows the 3+1 TC. Permutations include:
• E1 : 3+1 TC in OS.
• E2 : 3 TC in OS, 1 TC in FS.
• E3 : 2 TC in OS, 2 TC in FS.
• E4 : 1 TC in OS, 3 TC in FS.
• E5 : 3+1 TC in FS
Equations 5-9 comprise the state equations system associated with this example.
Equation 10 shows the probability that at least 3 TC in the CS are operating.
Equation 11 shows the probability of having 2 or 1 TC operating.
Fig. 5 presents the solution obtained using the model described, with TC in failure state shown in bold.
Failure probability
Subsystem CS is considered separately from subsystem TC. A CS failure does not mean failure of all TC. Even if all TC of a CS are in good operating condition, however, the possibility of a compressor station breakdown remains. CS failures are usually due to secondary components, particularly control chains and electrical supply equipment. Assuming an identical reliability index λCS and μCS for all compressor stations, using the k-out-of-n rule, Equation 12 shows the probability to get k CS out of service.4 6
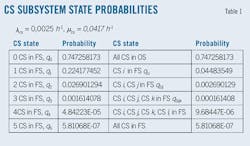
Table 1 presents an application of this model for the natural gas transmission pipeline linking Hassi R'mel to Skikda with 5 CS.
Equation 13 determines the probability that a pipe leg is in a good operating state (OS).
Reliability model
Gas pipelines of low or average length, such as the Algerian pipelines, are unlikely to suffer a simultaneous failure of more than two elements. Elementary probabilities thats use fundamental theorems of probabilities theory calculate the probability of each event. Table 2 shows statistically significant events and their corresponding probability models. . .
Hydraulic simulation
Each failure state, Ek, has an associated flow rate, Qk. Hydraulic relations describing the steady-state gas flow within a pipeline combined with performance characteristics of the TC can determine flow rate. Fig. 6 shows the results of applying SIMONE gas pipeline simulation software to this task.
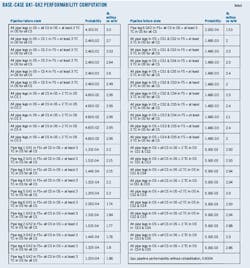
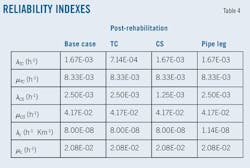
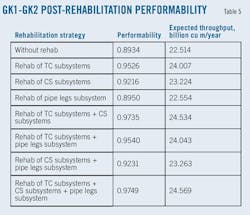
The last column of Table 3 shows the results from applying SIMONE to a gas pipeline supplying the Skikda LNG plant from Hassi R'mel field. Table 3 also shows the most statistically significant results derived, during consideration of 1-2 simultaneous failures on gas pipeline GK1/GK2, out of 259 different combinations. The data reported in Table 4 yield the results obtained for various rehabilitation strategies shown in Table 5.
References
1. Misra, K.B., "Handbook of Performability Engineering," Springer, Rueil-Malmaison, France, 2008.
2. Furchtgott, D.P. and Meyer, J.F., "A Performability Solution for Degradable Non-repairable Systems," IEEE Transactions on Computers, Vol. C-33, No. 6, pp. 550-554, June 1984.
3. Meyer, J.F., "Performability: A Retrospective and Some Pointers to the Future," Performability Evaluation, No. 14, pp. 139-156, 1992.
4. Smati, A., Younsi, K., and Ainouche, A., "Algerian LNG-chain Reliability Modeling Using Systemic Approach and Bayesian Inference," Gas Technology Institute's First Annual Natural Gas Technologies Conference and Exhibition, Orlando, Fla., Sept. 29-Oct. 2, 2002.
5. Mesarovic, M.D., Macko, D., and Takahara Y., "Theory of Hierarchical Multilevel Systems," New York: Academic Press, 1970.
6. Smati, A., Younsi, K., Zeraibi, N., and Zemmour, N., "Modélisation de la disponibilité d'une chaîne de GNL sur la base d'une approche bayesienne d'estimation des indices de fiabilité," Oil & Gas Science and Technology, Vol. 58, No. 5 (September-October 2003), pp. 531-549,.
7. Ainouche, A., Smati, A., and Younsi, K., "Reliability of LNG and Natural Gas Transmission Chain," World Petroleum Congress, Rio de Janeiro, Sept. 1-5, 2002.
8. Smati, A. and Younsi, K., "Approches frequentiste et bayesienne d'estimation de la disponibilité d'un gazoduc," Multidisciplinary International Conference, Bordeaux, France, Mar. 16-18, 2005.
9. Kapur, K.C., and Lamberson, L.R., "Reliability in engineering design," New York: Wiley, 1977.
10. Barlow, R.E., and Proshan, F., "Mathematical Theory of Reliability," New York: Wiley, 1965.
11.vStrook, D.W., "An Introduction to Markov Processes," Springer, Rueil-Malmaison, France, 2005.
12. Tamir, A., "Applications of Markov Chains in Chemical Engineering," Burlington: Elsevier Science, 1998.
The authors
Karim Younsi ([email protected]) is a lecturer-researcher in the oil and gas department of University of Boumerdes, Algeria. He holds a BS in engineering (1997) and an MS in reliability (2002) from the University of Boumerdes.
Ammar Chebouba ([email protected]) is a lecturer-researcher in the hydrocarbons and chemistry department of University of Boumerdes, Algeria. He holds a PhD in mechanical engineering (2009) from the University of Boumerdes.
Nordine Zemmour ([email protected]) is a lecturer-researcher in hydrocarbons and chemistry at the University of Boumerdes, Algeria. He holds a PhD in process engineering (1985) from Moscow Oil and Gas Academy.
Abdelnacer Smati ([email protected]) is head manager of Pegaz Engineering Algeria. He has also served as technical manager at Petrogaz-E&S and as lecturer-researcher in hydrocarbons and chemistry at the University of Boumerdes. He holds a PhD in mechanical engineering (1986) from Moscow Oil and Gas Academy.
