2012 ethylene production bounces back; turnarounds in early 2013 to curb output
Dan Lippe
Petral Consulting Co.
Houston
With parts of European still struggling with sovereign debt problems and key members of the European Union reconsidering the benefits and disadvantages of further economic and political integration, the global economic outlook for US petrochemical producers in 2013 is a little brighter than 6 months ago (OGJ, Sept. 3, 2012, p. 90), due to continued growth in the use of ethane as the primary ethylene feedstock.
During 2013, US ethylene producers will complete four incremental expansions and restart one production train (OGJ Online, May 1, 2012; July 2, 2012; Sept. 25, 2012; Jan. 14, 2013; Jan. 29, 2013). These projects will increase production capacity by 2.2 billion lb/year. Furthermore, US ethylene producers will continue to retrofit multifeed plants to increase ethane cracking capabilities.
These projects are based on recognition of ethane's economic advantage, compared with heavy feedstocks such as naphtha, condensate, and gas oil. In 2012, ethylene produced from ethane accounted for about 71% of US ethylene production, compared with 55% in 2007. Ethylene production based on cost-advantaged ethane will be about 75% of US ethylene production in 2013.
As ethylene producers increased cost-advantaged ethylene production, exports of high-density polyethylene, low-density polyethylene, and linear low-density polyethylene for 2012 (year-to-date through November) were 2.2% higher than the average for exports in 2010 and 2011. Furthermore, the cost advantage for ethylene produced from ethane, compared with heavy feeds widened in 2012.
Feed slate trends
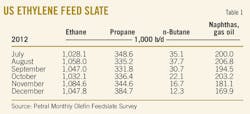
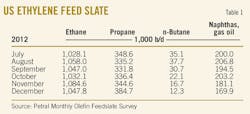
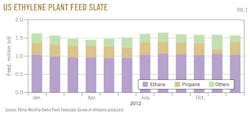
Feedback from ethylene producers showed ethylene industry's demand for fresh feed was 1.62 million b/d in third-quarter 2012 but declined to 1.61 million b/d in fourth-quarter 2012. Demand for fresh feed in third-quarter 2012 was 15,900 b/d (1%) less than in third-quarter 2011. Demand in fourth-quarter 2012 was 22,800 b/d (1.4%) more than in fourth-quarter 2011. The decline in demand for fresh feed was consistent with declines in ethylene production in third-quarter 2012.
Based on feedback from ethylene producers, demand for LPG feeds (ethane, propane, and normal butane) averaged 1.42 million b/d during third-quarter 2012 and increased to 1.43 million b/d in fourth-quarter 2012. Demand for LPG feed in third-quarter 2012 was 71,800 b/d (5.3%) more than in third-quarter 2011. Demand for LPG feed in fourth-quarter 2012 was 77,200 b/d (5.7%) more than in fourth-quarter 2011.
Finally, LPG feeds accounted for 87.6% of fresh feed in third quarter 2012 and 88.5% in fourth quarter. LPG feed share of total fresh feed in third and fourth quarters 2012 was equal to record highs. For 2005-07, LPG feeds accounted for 70% total fresh feed.
Economics for ethane compared with heavy feeds remained consistently favorable during second-half 2012. Ethylene producers continued to increase their use of ethane and further reduced their use of heavy feeds. Ethane's share of total fresh feed was 64.6% in third-quarter 2012 and 65% in fourth-quarter 2012, compared with 62% in second-half 2011.
After a very heavy slate of plant turnarounds in second quarter, there were no turnarounds in third-quarter 2012 and only three plants were down for turnaround in fourth-quarter 2012. The lighter turnaround schedule was a primary factor supporting the increase in demand for LPG feeds in second-half 2012.
Table 1 shows trends in olefin plant fresh feed.
Petral Consulting Co. forecasts ethylene plants in the US will operate at 88-92% of nameplate capacity during first-half 2013. Demand for fresh feed will average 1.55-1.65 million b/d during first and second quarters 2013. Based on this forecast, demand for LPG feeds will average 1.43-1.45 million b/d during first and second quarters 2013.
Fig. 1 shows historic trends in ethylene feed.
US ethylene production
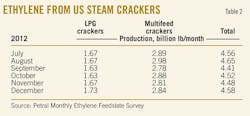
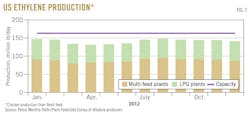
Based on feedback from ethylene producers, Petral Consulting estimates ethylene production from olefin plants averaged 148.0 million lb/day in third-quarter 2012 and 147.6 million lb/day in fourth-quarter 2012. Ethylene production in third-quarter 2012 was 55 million lb (0.4%) less than in third-quarter 2011; production in fourth-quarter 2012 was 224 million lb (1.7%) more than in fourth-quarter 2011.
There were no plants out of service due to scheduled maintenance or turnarounds in third-quarter 2012, but capacity out of service due to scheduled turnarounds averaged 3 billion lb/year (5% of nameplate capacity) in fourth-quarter 2012.
Based on feedback from ethylene producers, Petral Consulting estimates production from LPG plants averaged 54.0 million lb/day in third-quarter 2012 and was 54.8 million lb/day in fourth-quarter 2012. Production from LPG plants in third-quarter 2012 was 136 million lb (2.7%) less than in third-quarter 2011. Production for fourth-quarter 2012 was 5 million lb (0.1%) more than in fourth-quarter 2011.
Ethylene production from multifeed plants averaged 94.0 million lb/day in third-quarter 2012 and declined to 92.8 million lb/day in fourth-quarter 2012.
Production in third-quarter 2012 was 82 million lb (1.0%) more than during third-quarter 2011. Production from multifeed plants in fourth-quarter 2012 was 219 million lb (2.6%) more than in fourth-quarter 2011.
Table 2 shows trends in ethylene production.
As long as variable production costs based on ethane and propane remain less than costs based on light naphtha and other heavy feeds, ethylene producers will continue to operate LPG plants at full rates during first and second quarters 2013 and will operate multifeed plants at lower rates, as needed, to balance the market.
Fig. 2 shows trends in ethylene production.
Coproduct supply from olefin plants
Coproduct propylene supply depends primarily on the use of propane, normal butane, naphtha, and gas oil feedstocks. Based on feedback from ethylene producers, demand in third-quarter 2012 was 338,500 b/d for propane, 34,000 b/d for normal butane, and 200,000 b/d for heavy feeds.
In fourth-quarter 2012, demand was 355,000 b/d for propane, 17,000 b/d for normal butane, and 185,000 b/d for heavy feeds. Total demand for feeds with high propylene yield was 573,000 b/d in third-quarter 2012 and was 72,000 b/d (11.2%) less than in third-quarter 2011. Total demand for these feeds in fourth-quarter 2012 was 557,000 b/d and was 24,000 b/d (4.1%) less than in fourth-quarter 2011.
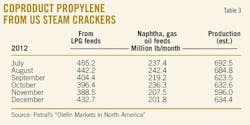
Coproduct supply (based on estimates derived from feedback from ethylene producers) increased in third-quarter 2012 but declined in fourth-quarter 2012. Production averaged 21.7 million lb/day in third-quarter 2012 and 20.3 million lb/day in fourth-quarter 2012.
Coproduct supply for third-quarter 2012 was 237 million lb (10.6%) less than in third-quarter 2011. Coproduct supply for fourth-quarter 2012 was 170 million lb (8.4%) less in fourth-quarter 2011.
Propylene production from LPG feeds averaged 14.1 million lb/day in third-quarter 2012 and 13.2 million lb/day in fourth-quarter 2012. Production from LPG feeds in third-quarter 2012 was 76 million lb (6.2%) more than in third-quarter 2011. Production from LPG feeds in fourth-quarter 2012 was 39 million lb (3.3%) more than in fourth-quarter 2011.
The key factor was the year-to-year increase in propane demand. Demand for propane in third-quarter 2012 was 38,000 b/d (12.6%) more than in third-quarter 2011. Demand for propane in fourth-quarter 2012 was 47,900 b/d (15.6%) more than in fourth-quarter 2011.
Propylene production from heavy feeds increased in third-quarter 2012 but declined in fourth-quarter 2012. Coproduct propylene from heavy feeds averaged 7.6 million lb/day in third-quarter 2012 and 7.0 million lb/day in fourth-quarter 2012. Production from heavy feeds in third-quarter 2012 was 313 million lb (30.9%) less than in third-quarter 2011. Production from heavy feeds in fourth-quarter 2012 was 210 million lb (24.6%) less than in fourth-quarter 2011.
Table 3 shows trends in coproduct propylene supply.
According to PetroChem Wire (www.petrochemwire.com), the propane dehydrogenation plant operated by PL Propylene (OGJ, Mar. 7, 2011, p. 94) experienced maintenance-related downtime in July and December. As a result, the plant produced an estimated 3.1-3.2 million lb/day during third quarter and 3.0-3.1 million lb/day in fourth quarter 2012. Production in second-half 2012 was 0.7 million lb/day (18%) less than in first half 2012.
Refinery propylene supply
Refinery propylene sales into the merchant market are a function of fluid catalytic cracker unit (FCCU) feed rates, FCCU operating severity, and economic incentives to sell propylene rather than use it as alkylate feed. Variations in FCCU feed rates are the most important parameter and economic factors are generally of secondary importance.
US Energy Information Administration (EIA) statistics show FCCU feed rates averaged 5.02 million b/d in third-quarter 2012 and were an estimated 5.0 million b/d in fourth-quarter 2012. FCCU feed rates in third-quarter 2012 were 166,000 b/d (3.2%) less than in third-quarter 2011; feed rates in fourth-quarter 2012 were 140,000 b/d (2.9%) more than in fourth-quarter 2011.
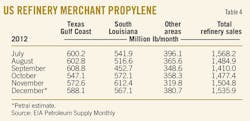
According to EIA, refinery-grade propylene production averaged 48.5 million lb/day in third-quarter 2012 and 49.1 million lb/day in fourth-quarter 2012. Production in third-quarter 2012 was 454 million lb (9.2%) less than in third-quarter 2011. Production in fourth-quarter 2012 was 97 million lb (2.1%) less than in fourth-quarter 2011.
Table 4 tracks refinery merchant propylene sales.
US propylene production
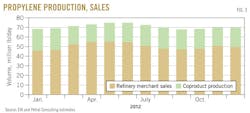
Based on EIA statistics for refinery-grade propylene and Petral Consulting estimates for coproduct supply, total US propylene supply declined in third-quarter 2012 and averaged 70.2 million lb/day.
Production was 10.7 million lb/day (3.2%) less than in third-quarter 2011. US propylene supply in fourth-quarter 2012 also declined and averaged 69.4 million lb/day. Production was 5.7 million lb/day (7%) less than in fourth-quarter 2011.
Fig. 3 shows trends in coproduct and refinery merchant propylene sales.
Ethylene economics, pricing
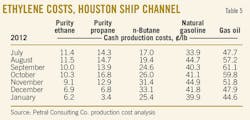
Variable production costs for ethylene in the Houston Ship Channel (assuming full spot prices for all coproducts) based on purity-ethane feeds averaged 11¢/lb in third-quarter 2012. Variable costs based on ethane for third-quarter 2012 were 1.5¢/lb less than in second-quarter 2012 and 14¢/lb lower than year-earlier costs.
In third-quarter 2012, purity ethane provided ethylene producers with cost savings of 29¢/lb, compared with natural gasoline. The cost advantage for ethane, compared with natural gasoline in third-quarter 2012, was 18¢/lb more than in third-quarter 2011 and 16¢/lb more than in third-quarter 2010.
Variable production costs based on purity ethane declined to 9¢/lb in fourth-quarter 2012 and were 2¢/lb lower than in third-quarter 2012 and 16¢/lb lower than in fourth-quarter 2011. Purity ethane provided producers with a cost savings of 34¢/lb, compared with natural gasoline in fourth-quarter 2012. The cost advantage compared with natural gasoline was 14¢/lb more than in fourth-quarter 2011 and 15¢/lb more than in fourth-quarter 2010.
For second-half 2012, ethane's cost advantage compared with natural gasoline averaged 31¢/lb. For a plant with a capacity of 1 billion lb/year based on natural gasoline and similar light naphtha, the cost savings in second-half 2012 was about $150 million.
The widening cost advantage for ethane compared with natural gasoline and similar light naphtha provides strong economic support for continued retrofit projects of existing naphtha-based capacity and further expansion of US ethylene production capacity based on ethane as the primary feed.
Variable production costs for purity propane averaged 14¢/lb in third-quarter 2012; costs based on propane were 2¢/lb more than in second-quarter 2012 and 14¢/lb less than in third-quarter 2011. Production costs declined to 12¢/lb in fourth-quarter 2012 and were 2¢/lb less than in third-quarter 2012 and 18¢/lb less than in fourth-quarter 2011.
Variable production costs for propane were 3.3¢/lb more than ethane for third-quarter 2012 and 3.4¢/lb more in fourth-quarter 2012. Propane provided ethylene producers with cost savings of 25¢/lb relative to natural gasoline in third-quarter 2012 and 30¢/lb in fourth-quarter 2012.
Production costs for natural gasoline averaged 40¢/lb for third-quarter 2012 and increased to 43¢/lb in fourth-quarter 2012. Production costs for natural gasoline in third-quarter 2012 were 4¢/lb more than in second-quarter 2012 and 3¢/lb more than in third-quarter 2011. Production costs for natural gasoline in fourth-quarter 2012 were 9¢/lb less than in fourth-quarter 2011.
Table 5 presents trends in ethylene production costs.
Ethylene pricing, profit margins
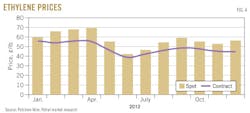
Spot prices for ethylene averaged 53¢/lb in third-quarter 2012 and 55¢/lb in fourth-quarter 2012 according to PetroChem Wire. The contract benchmark, however, was 45¢/lb in third-quarter 2012 and 46¢/lb in fourth-quarter 2012.
The spot market's price premium compared with the contract benchmark narrowed to 8¢/lb in third-quarter 2012 but increased to 9¢/lb in fourth-quarter 2012. Before 2011, spot prices were typically discounted, compared with the contract benchmark.
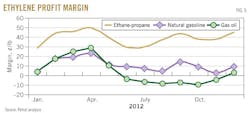
Margins based on contract benchmark prices were steady and strong for ethane and propane in third and fourth quarters 2012, but margins for natural gasoline and naphtha weakened. Margins based for purity ethane were 39¢/lb in third-quarter 2012 and increased to 42¢/lb in fourth-quarter 2012. Petral Consulting calculates margins based on spot ethylene prices minus full cash costs (variable costs plus fixed cash costs).
Margins for propane were 35¢/lb in third-quarter 2012 and increased to 39¢/lb in fourth-quarter 2012. Margins based on natural gasoline feeds, however, narrowed to 9¢/lb in third-quarter 2012 and 7¢/lb in fourth-quarter 2012.
Fig. 4 shows historic trends in ethylene prices (spot prices and net transaction prices). Fig. 5 shows profit margins based on spot ethylene prices and variable production costs.
Refinery, polymer-grade propylene pricing
According to EIA statistics, inventory of refinery-grade propylene averaged 850 million lb in third-quarter 2012 and were 334 million lb (65%) more than the 2009-11 average.
The inventory surplus continued to have a strong bearish influence on spot prices during third-quarter 2012. Spot prices for refinery-grade propylene, according to PetroChem Wire, were 38¢/lb in third-quarter 2012, compared with 52¢/lb in second-quarter 2012. The severity of the decline in prices in third-quarter 2012 is best illustrated by the trend in the premium or discount compared with unleaded gasoline. Spot prices for refinery-grade propylene were also 10¢/lb less than spot prices for unleaded regular gasoline in third-quarter 2012 compared with 5¢/lb more in second-quarter 2012.
EIA statistics, however, showed refinery-grade propylene inventory declined about 170 million lb in fourth-quarter 2012. As the inventory surplus declined, spot prices for refinery-grade propylene increased to 45-50¢/lb in fourth-quarter 2012, according to PetroChem Wire. The pricing differential for refinery-grade propylene, compared with unleaded regular gasoline, also improved to a premium of 6.6¢/lb in fourth-quarter 2012.
In third-quarter 2012, the contract benchmark for polymer-grade propylene dropped to 51.3 ¢/lb and was 13.8 ¢/lb less than the average for second-quarter 2012. As spot prices for refinery-grade propylene rose in fourth-quarter 2012, the contract benchmark for polymer-grade propylene increased to 56¢/lb average for the quarter.
Premiums for polymer-grade propylene contract benchmark prices, compared with spot refinery-grade propylene prices, were steady in third-quarter 2012 and averaged 13.6¢/lb, compared with 13.2¢/lb in second-quarter 2012. Premiums for polymer-grade propylene narrowed to 7.3¢/lb in fourth-quarter 2012, however.
First-half 2013 outlook
Despite continued growth in US crude oil production and the ongoing decline in US crude oil imports, trends in global crude oil prices were bullish during fourth-quarter 2012 and the trend continued in January 2013. To some extent, crude oil traders become more optimistic in the outlook for global economic growth based on improvement in China's economic performance during fourth-quarter 2012; HSBC's Purchasing Managers Index was at a 2-year high in January 2013.
In particular, the improvement in China's economic growth in fourth-quarter 2012 encouraged crude oil buyers and traders to be more optimistic about growth in demand for crude oil in China during first-half 2013.
Additionally, preliminary estimates indicate Saudi Arabia's crude oil production in December 2012 was about 700,000 b/d less than in July 2012. During first-half 2012, Saudi Arabia maintained production at about 10 million b/d, according to EIA statistics, to help offset the decline in Iranian crude oil exports. Regardless of Saudi Arabia's rationale to reduce crude oil production, the market reacted bullishly to reduced output from Saudi Arabia.
US production will continue to increase during first-half 2013, however, and the need for imports into North America will continue to decline. As is generally true, however, crude oil buyers and traders will continue to react to changes in production in Saudi Arabia.
While the economic outlook in Asia has improved, sovereign debt problems in Europe will continue to limit prospects for economic growth during first-half 2013. US economic indicators are a mixed bag with housing starts and automobile sales stronger. European economic and political problems point to weaker gross domestic product (GDP) growth in second half.
Domestically, crude oil supply-demand trends were bearish during fourth-quarter 2012. Commercial crude oil inventory remained near record high levels on Dec. 31, 2012, and domestic crude oil production continued to grow. Internationally, crude oil supply-demand trends were bullish during fourth-quarter 2012.
Based on EIA statistics for crude oil plus lease condensate, world crude oil production (excluding North America) was 63.2 million b/d in third-quarter 2012 and was 714,000 b/d (1.1%) less than in first-quarter 2012.
Most likely, based on cuts in production in Saudi Arabia, global production (excluding production in North America) fell again in fourth-quarter 2012 and, most likely, will be flat or decline further in first and second quarters 2013. Petral Consulting forecasts dated Brent prices will average $110-115/bbl in first and second quarters 2013.
Petral Consulting forecasts variable ethylene production costs based on ethane will decline in first and second quarters 2013, compared with fourth-quarter 2012, and will average 6-8¢/lb.
Variable production costs based on propane in first-quarter 2012 will be as much as 8¢/lb less than in fourth-quarter 2012, due to steady prices and strong coproduct credits due to the surge in propylene prices in January 2013.
Petral Consulting forecasts, however, that variable production costs based on propane will increase to 9-11¢/lb in second-quarter 2012. The outlook for an increase of 5-7¢/lb in variable production costs is based on a gradual recovery in spot propane prices and a gradual decline in coproduct credits.
Variable production costs for light naphtha have been an important consideration for spot ethylene prices since 2008, but gas oil was the highest cost feedstock during third and fourth quarters 2012. Variations in variable production costs for the high-cost feedstock are usually a very important consideration in trends in spot ethylene prices.
Petral Consulting forecasts indicate gas oil will remain the high-cost feedstock in first-quarter 2013, but natural gasoline and gas oil will yield similar variable production costs in second-quarter 2013. Spot prices for high-sulfur distillate fuel oil are the basis for gas oil production costs.
Petral Consulting forecasts variable production costs based on gas oil will average 44-46¢/lb in first-quarter 2013. As spot prices for high-sulfur distillate fuel oil decline in second-quarter 2013, variable production costs based on gas oil will weaken and average 36-38¢/lb.
Based on variable costs plus fixed cash costs for gas oil and natural gasoline, Petral Consulting forecasts spot ethylene prices will average 55-60¢/lb in first-quarter 2013. Based on prices in this range, profit margins for high-cost production (ethylene produced with gas oil or naphtha) will be 5-15¢/lb.
By the end of first-quarter 2013, incremental expansions will increase ethane-based production capacity by 1.3-1.4 billion lb/year, compared with fourth-quarter 2012. Ethylene producers increase production from low-cost light feeds by 3.5-3.8 million lb/day and will reduce output from high-cost heavy feeds in multifeed plants by an equivalent volume.
Alternatively, ethylene producers may allow inventory to increase by 300-400 million lb by the end of second-quarter 2013. The continued shift to production from ethane and propane will eventually undermine spot ethylene prices. Petral Consulting forecasts spot ethylene prices will fall to 45-55¢/lb in second-quarter 2013.
We forecast premiums for spot prices compared with the benchmark net transaction price will average 10-12¢/lb in first-quarter 2013, but premiums will narrow to 5-8¢/lb in second-quarter 2013. On this basis, net transaction prices will average 46-48¢/lb in first-quarter 2013 and 42-46¢/lb in second-quarter 2013.
Prices for refinery-grade propylene did not recover from depressed levels in second-half 2012 until late October and early November. Pricing differentials between refinery-grade propylene and US Gulf Coast unleaded regular gasoline were 4-6¢/lb in November and 6-12¢/lb in December.
Spot prices for refinery-grade propylene surged in January of this year and were about 20¢/lb more than in late December. Furthermore, price premiums compared with unleaded regular gasoline also surged and were almost 30¢/lb during the last 2 weeks of January. Premiums of more than 20-25¢/lb did not generally persist for more than a few months until 2011.
Two factors sparked the surge in refinery-grade propylene prices in January:
• FCCU operating rates usually decline during first-quarter and byproduct propylene supply declines too.
• EIA weekly statistics showed refinery-grade propylene inventory fell almost 130 million lb (20%) during the first half of January. With FCCU operating rates at seasonally minimum levels during first-quarter 2013, refinery-grade propylene inventory will also decline relative to fourth-quarter 2012 volumes.
The surge in refinery-grade propylene prices contributed to an increase in the contract benchmark price for polymer-grade propylene in January, but the premium for contract benchmark pricing for polymer-grade propylene, compared with spot prices for refinery-grade propylene, was 5.3¢/lb, compared with 7.3¢/lb in fourth-quarter 2012 and 13.6¢/lb in third-quarter 2012.
As refinery-grade propylene inventory continues to fall, the tightening supply-demand balance will support spot prices at 20-25¢/lb premiums, compared with Gulf Coast unleaded regular gasoline prices. In second-quarter 2013, however, Petral Consulting forecasts spot prices for refinery-grade propylene will decline 4-7¢/lb and average 62-64¢/lb.
According to statistics published by USA Trade Online (www.usatradeonline.gov), exports of polypropylene were 6.4-6.5 million lb/day in third-quarter 2012 and were 11.3% less than average exports in 2011. Exports increased in October-November and averaged 7.36 million lb/day, or 1% more than in 2011, but were about 33% less than the average for 2009.
The surge in prices for refinery-grade propylene and polymer-grade propylene in January may undermine the fledgling recovery in polypropylene exports that began in fourth-quarter 2012. Additionally, the seasonal increase in merchant sales of refinery-grade propylene will likely depress spot prices for refinery-grade propylene beginning in May or June.
Based on these considerations, Petral Consulting forecasts the contract benchmark price for polymer-grade propylene will fall from a first-quarter high of 78-82¢/lb in March to 65-69¢/lb in June. The contract benchmark price will average 77.5¢/lb in first-quarter 2013 and 71¢/lb in second-quarter 2013.
The author
Daniel L. Lippe ([email protected]) is president of Petral Consulting Co., which he founded in 1988. He has expertise in economic analysis of crude oil, refined products, natural gas, NGLs, other ethylene feedstocks, and primary petrochemicals. Lippe began his professional career in 1974 with Diamond Shamrock Chemical Co., moved into professional consulting in 1979, and has served petroleum, midstream, and petrochemical industry clients since that time. Lippe holds a BS (1974) in chemical engineering from Texas A&M University and an MBA (1981) from Houston Baptist University. He is an active member of the Gas Processors Suppliers Association and serves on GPA's NGL Market Information Committee.
