Shale gas and oil: fundamentally changing global energy markets

Roberto F. Aguilera
Curtin University
Perth, Australia
Marian Radetzki
Lulea University of Technology
Lulea, Sweden
| This article draws upon an extensive text under publication in the academic journal Mineral Econonics. |
Shale production on a significant scale arose quite recently and is so far limited to the US with gas having a few years' lead on oil.
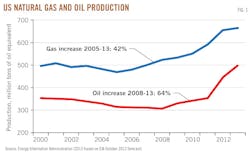
Fig. 1 reveals that shale has already had a significant impact on US gas and oil output. In our view, this is just a humble beginning.
Further sizable production increases can be expected in the US, and the shale revolution is likely to spread, with a lag, across the globe. This will result in fundamental repercussions for international energy markets.
We try to track and explain what has happened so far and what can be expected in coming decades as the shale revolution matures and gains international spread. We end by briefly speculating about the implications of it all for the gas and oil markets and energy politics.
Definitions, triggers, and characteristics
The resources in focus of our attention, comprising shale gas and coalbed methane along with tight gas and tight oil, typically lack strict definitions and they often overlap.1 However, they are all characterized by low permeability that yields commercially insufficient flows from vertical drilling. We simplify, by following recently spreading conventions2 and refer in what follows to all these resources as shale gas and shale oil.
At this time, all shale resources are referred to as "unconventional." We avoid this concept because it is much broader than our definition of "shale" but also because we find it subjective and unstable over time.
The shale revolution is the result of technological breakthroughs in horizontal drilling and hydraulic fracturing that have made vast dormant gas and oil resources economically exploitable. The technology was originally developed in the US in the 1940s, but application was quite limited until it was revolutionarily improved about the turn of the century.3
Geological and engineering characteristics such as gas and oil in place, depth, permeability, porosity, organic richness, saturations, and reservoir pressure are essential cost determinants of shale plays.4
Exploitation of shales is characterized by high output in the first year, followed by sharp declines. Production in the second year is typically down by 40% from the first year with further reductions in the following years.5 New wells have to be drilled continuously to maintain production, and output reacts speedily to price changes. Investments are characterized by short payback periods.
Shale resource exploitation has aroused widespread environmental concerns, with claims of large methane emissions, unsustainable use of fresh water, and contamination of aquifers during the fracking process. The speedy expansion and large-scale application of the new technology has obviously suffered from environmental teething troubles, but many of the claims appear to have been exaggerated.
Furthermore, recent research6-12 suggests that many of the problems are being overcome as the technology matures and is subjected to stricter environmental control.
Impact of shales on US output
Until 2005, the US gas production trend was negative, with the highest level, 560 million tons of oil equivalent (mtoe) recorded in the early 1970s. In 2005, the trend reversed, and output has increased 42% to 664 mtoe in 2013.
Oil had its peak in 1970, at 534 million tonnes, from which it fell to 305 mt in 2008, the year of the turnaround. The subsequent rise to 499 mt in 2013 corresponds to a staggering 64% increase.
While the shale revolution was instrumental to the trend shifts, developments were accentuated by the sharp increase in US gas prices in 2000 and an equally strong rise in international oil prices 4 years later.
The profitability of shale gas has strongly boosted the effort to identify shale resources and to assess their economic potential. In the past 10 years, the vision of the US gas resource position has undergone a complete change, from scarcity to abundance.13 14
In 2008, shale gas accounted for more than half of total US gas output. One study15 puts the costs in a range between $3 and $7/MMBTU, which compares favorably with most gas sources in the world.
Medlock13 reports that one fourth of the US shale resources identified in 2009 are extractable at total costs below $3/MMBTU, at par or below the cost of US conventional gas. Costs depend importantly on the availability of liquids whose sales proceeds can be credited to the costs of gas extraction.
Large-scale exploitation of shale oil in the US is even more recent, and knowledge about the recoverable resource base is highly incomplete. An analysis by the EIA16 puts the total at nearly 8 billion tons, which is about 66% more than the country's overall proved oil reserves.
US production of oil spectacularly rose from 305 million tons in 2008 to an estimated 499 million tons in 2013, most of the rise attributed to shale (Fig. 1).
Shale oil resources under exploitation have costs typically lower than Canadian oil sands or Brazilian ultradeepwater crude, both of which are estimated to have average production costs of about $70/bbl.17 Shale oil exploitation in North America becomes broadly economical at oil prices somewhat below $50/bbl.18 Production outside the US has remained insignificant so far.
Price reactions and wider implications
The oil market is globally integrated so there is a single world price for a given quality.
The shale revolution has not yet had a perceptible price impact. In gas, however, existing regional markets are separated by high transport costs and differing market structures, so the US production increase has suppressed prices in North America.
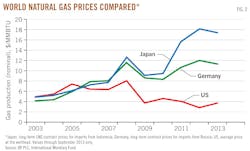
Fig. 2 reveals that the deviation between the US and other markets rose sharply from 2009 onwards, as the US the shale output expansion gained speed. The figure also demonstrates US prices in 2009-13 far below the levels that prevailed in 2003-08, prior to the price impact of rising supplies.
With shale gas costs in a range of $3-7/MMBTU,15 one might reasonably have expected shale output to decline when prices fell from $6-8 to $4 or less from 2009 onwards.
Indeed, the number of drilling rigs devoted to shale gas fell from about 1,500 in 2008 to less than 900 in 2011 as rigs were shifted to shale oil.18 Astonishingly, however, this had no apparent impact on gas production growth (Fig. 3). Dramatically increasing efficiency in drilling operations provides a plausible explanation to this observation.19
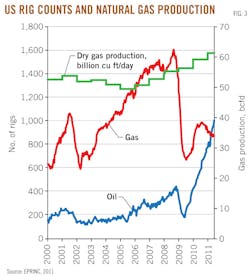
Overall US gas output per rig in use rose more than threefold between 2008 and 2012.20 A move to the exploitation of wetter resources with greater returns from gas liquids, and hedging while prices were still high, provide additional explanations to the gas output performance after 2009.
Cheap gas has been a bonanza to the US. The competitiveness of the US petrochemical industry has strengthened greatly, to the chagrin of its European and Japanese competitors. More generally, the US economy has been significantly stimulated by the employment, investment, and public revenue effects of the shale gas activity.21 22
A sizable shift from coal to gas has occurred in power generation,23 leaving a surplus of coal supply. Coal output and coal prices declined between 2007 and 2012, but exports more than doubled in the period.24
Increasing domestic gas supplies have sharply cut US gas import needs. Between 2007 and 2012, total imports fell by 32% to 80 mtoe, while LNG imports collapsed by 78% to 4.4 mtoe,25 idling existing LNG import facilities and prompting their conversion towards exports. A number of LNG export projects are currently planned, and when in full use, their capacity would add about 50% to 2012 global LNG exports.25
The collapse of US LNG imports is having some dampening impact on prices in Europe and Asia as LNG supplies intended for the US are redirected to other destinations. However, this has been temporarily countered by exploding Japanese demand following the Fukushima nuclear disaster.
Russian gas exporter Gazprom, whose sales are dominated by long-run contracts with prices tied to high-priced oil, has been forced to make painful adjustments as spot prices have fallen in the European market.
A vision of emerging excess supplies of gas as the Japanese situation normalizes and the US starts exporting LNG is bound to have a depressive effect on gas prices in all regional markets while increasing the role of spot prices.26
The repercussions so far of the US shale oil revolution on oil markets have been much less evident. The main change related to the oil market is a decline in US import needs. In 2008, US oil consumption exceeded domestic output by 570 million tons. By 2012, the difference had shrunk to 470 million tons, predominantly due to an increase in domestic shale output.
Shale oil resources in the US become economically exploitable at oil prices between $45 and $70/bbl.27 This is somewhat less than the price level required by Canadian oil sands and substantially below the 2011-13 prices for crude oil.
The Canadian Energy Research Institute claims that oil sands production costs require breakeven oil prices in the range $45 to $90/boe.28 Liquids from shale gas are much cheaper to produce, ranging from around $10 to $40/boe.15
The US: Have we only seen the beginning?
Recent projections formulated by the US Department of Energy, the International Energy Agency, and also by the quoted IHS study suggest a very large-scale expansion in US shale gas and shale oil activities in the coming 2 decades.
On the wave of the shale revolution, the US overtook Russia in 2009 as the world's largest gas producer. As noted, the US gas output increased by 42% between 2005 and 2013 to reach 664 mtoe. Russian output expanded by less than 3% until 2012, to attain 535 mtoe.
Both IEA and EIA envisage continued US gas production expansion mainly from shale exploitation, though at decelerating rates. IEA29 forecasts 2035 US gas output at 720 mtoe, only 8% above that of 2013. EIA's projections1 reach 815 mtoe in 2035, an addition of 24% over 24 years. Both agencies predict US LNG exports by 2020.
Oil production, too, is projected by the EIA and IEA to expand on the shale wave (at least until 2020) but as with gas, at a much slower rate than in the recent past. By 2020, the US is seen to become the world's largest producer at some 530 mt, but the country never becomes self-sufficient. After 2020, the oil shale revolution is seen to be exhausted and output starts to decline.

The EIA's output growth projections are summarized (Table 1). The contrast between the actual numbers (from 2008 to 2012) and the projected numbers (from 2012 to 2035) is striking. The EIA foresees prices rising until 2035 to $6.32/MMBTU for gas (+63% from 2013) and to $145/bbl for oil (+43% from 2013), all in constant 2011 dollars.
We find the output and price projections surprisingly pessimistic against the background of experiences of the recent past when shale resources were repeatedly upgraded, productivity rose faster than expectations and costs and prices were declining.
The temporary nature of the revolution reflected in the projections is contradicted by the US shale resource wealth already identified and even more by the likely development from ongoing prospecting operations. The dynamics of technological progress and recoverable resource wealth qualities are astounding: between 2008 and 2013, the assessed size of the US Bakken shale oil formation rose more than fivefold to 2.5 billion tons.30
Will the shale revolution spread beyond the US?
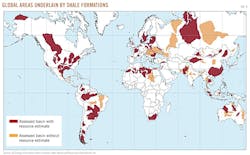
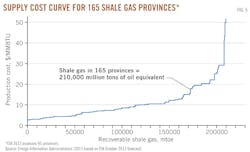
The global shale resource base is thought to be huge and widely spread, though poorly known (Fig. 4). There are no binding constraints to the geographical diffusion of shale extraction technology, so an international spread is likely. The crucial question is its timing.
The circumstances assuring the US lead in this field comprise include:
• A long history of large scale gas and oil exploitation guaranteed a technological prominence to the US, and a physical infrastructure easily adapted to the needs of shale.
• The US also possessed a valuable institutional infrastructure essential to promote innovative entrepreneurial activities.
• Sparse population has reduced environmental sensitivities.
• US legislation granting the landholder ownership rights to what is underground has greatly facilitated shale development.
• The US tradition of small, adventurous exploration enterprises has helped to speed up the revolutionary process.
The EIA assessment from 2013,16 covering 41 countries, estimates the technically recoverable resources of shale gas at 186,000 mtoe, about as much as global proved gas reserves.
China accounts for 15% of this total, Argentina 11%, Algeria 10%, US 9%, Canada 8%, Mexico 7%, Australia 6%, South Africa 5%, and Russia 4%. Brazil, Venezuela, Poland, Ukraine, France, and Libya also have a significant resource potential. Global shale gas cost estimates based on Aguilera et al, 2012,3 which assesses 165 provinces (compared with 95 provinces assessed in EIA, 2013,16 are shown in Fig. 5.
Build-up of needed infrastructure from scratch, the most extended delaying factor, may take up to 10 years. The vanguard position is therefore likely to be taken by gas producers such as Canada, Australia, Argentina, and Poland, whose existing infrastructure can be speedily adjusted to shale.
Existing infrastructure, matched with a lengthy history of oil and gas industry experience, gives Canada a strategic advantage in shale development. Canadian natural gas production currently ranks third in the world, with shale gas steadily increasing its share.
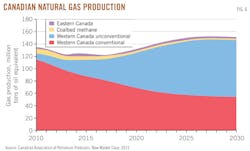
As shown in Fig. 6, the Canadian Association of Petroleum Producers31 expects Western Canadian unconventional gas (shale) to become the nation's dominant source of gas supply after 2020. By 2030, shale is seen to account for over 60% of total gas production.
Developments in Argentina, with a technically recoverable resource ranking second in the world by size, have faced political problems, but Chevron has recently committed to invest $1.24 billion in the Vaca Muerta formation.32
Poland's dependence on imports from Russia provides a strong political incentive to move ahead quickly. However, the high population density and environmental sensitivities in Europe constitute a deterrent to shale in most of the continent.
Despite an impressive resource wealth and the authorities very keen, China's gas industry does not expect much progress until after 2020.33 By 2035, however, shale is projected to account for 70% of total gas output.29
Current outlooks by more cautious energy specialists envisage that full international effects of shale gas will not be felt before the 2030s. But then, one must not forget the astonishing suddenness of development in the US for both gas and oil over the past decade. Similar surprises cannot be precluded for other nations with sizable shale resources.
A German study2 of global shale oil resources notes that exploration has barely begun. Even then, the assessed extractable resources, 87,000 million tons, correspond to almost 40% of global proved oil reserves, with China and Venezuela dominating the total (US share below 4%). As exploration gains speed, the volumes and the geographical spread are likely to rise. Nevertheless, it is clear that a breakthrough of shale oil extraction outside the US will lag that of shale gas.
Global implications
Though highly speculative, the following thought experiment attempts to quantify what a global shale revolution might yield (Table 2).
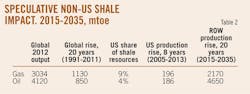
It is based on assessments presented above that the US share of global shale resource base is 9% for gas and 4% for oil. It is also based on the US 8-year production growth achievement until 2013 of 196 mtoe for gas and 186 mt for oil.
We abstract, cautiously, from undoubted future shale output increases in the US. We assume that the rest of the world is equally successful as the US was between 2005 and 2013 in exploiting its share of shale resources between 2015 and 2035; i.e. with a 10-year lag and at less than half the speed attained by the US.
This would yield a rest-of-the-world 2035 shale gas output of 2,170 mtoe and a shale oil output of 4,650 mt, the latter exceeding current global oil output!
The importance of these supply additions can be measured in many ways. We choose to compare them with the global historical production growth between 1991 and 2010. In that 20-year period, gas production increased by 1,130 mtoe while oil production expanded by 850 mt, including the impressive US output rises since 2005.
In this perspective, our projection appears as truly revolutionary—a game changer for the gas and oil markets. Is our exercise at all meaningful? We think that, if nothing else, it is a useful widener of concurrent visions of what plausibly could occur.
Space does not permit us to explore the full consequences of such a change. It suffices to say that the abundance caused by a successful shale revolution would have a strong impact on fossil prices with a stimulating impact on the world economy and hard to fathom changes in international political relations.
References
1. EIA, "Annual energy outlook," Energy Information Administration, Washington, DC, 2013.
2. DERA, "Energy study: reserves, resources and availability of energy resources 2012," Deutsche Rohstoffagentur, Hannover, 2012.
3. Aguilera, R.F., Ripple, R.D., and Aguilera, R., "Link between rocks, hydraulic fracturing, economics, environment, and the global gas portfolio," SPE Canadian Unconventional Resources Conference, CURC 2, 2013, pp. 1,044-68.
4. Orangi, A., et al., "Unconventional shale oil and gas-condensate reservoir production, impact of rock, fluid, and hydraulic fractures," SPE Paper 140536, SPE Hydraulic Fracturing Technology Conference and Exhibition, Woodlands, Tex., Jan. 24-26, 2011.
5. IEA, "World energy outlook," International Energy Agency, Paris, 2009.
6. Brantley, S.L., and Meyendorff, A., "The facts on fracking," The New York Times, Mar. 13, 2013 (http://www.nytimes.com/2013/03/14/opinion/global/the-facts-on-fracking.html).
7. Burnham, A., et al., "Life-cycle greenhouse gas emissions of shale gas, natural gas, coal, and petroleum," Environmental Science and Technology, Vol. 46, 2012, pp. 619-627.
8. Hunter, T., "Regulation of shale, coal seam and tight gas activities in Western Australia," Bond University, Queensland, July 2011.
9. Nicot, J.P., and Scanlon, B.R., "Water use for shale gas production in Texas, US," Environmental Science and Technology, Vol. 46, 2012, pp. 3,580-86.
10. O'Sullivan, F., and Paltsev, S., "Shale gas production: potential versus actual greenhouse gas emissions," Environmental Research Letters, Vol. 7, No. 4, 2012.
11. Ripple, R.D., "There's more to coalseam gas than Gasland," The Conversation, May 26, 2011 (http://theconversation.com/theres-more-to-coal-seam-gas-than-gasland-1477).
12. US DOE, "Shale gas production subcommittee second ninety day report," Secretary of Energy Advisory Board, US Department of Energy, Washington DC, 2011.
13. Medlock, K.B., "Shale gas, emerging fundamentals, and geopolitics," presentation at James A. Baker III Institute for Public Policy, Rice University, June 14, 2012.
14. Potential Gas Committee, PGC press release, Colorado School of Mines, Golden, Colo., Apr. 9, 2013.
15. IEA, "Are we entering the golden age of gas?," International Energy Agency, Paris, 2011.
16. EIA, "Technically recoverable shale oil and shale gas resources: an assessment of 137 shale formations in 41 countries outside the United States," Energy Information Administration, Washington DC, June 2013.
17. GEA, "Global energy assessment: toward a sustainable future," Cambridge University Press, UK, 2012.
18. IEA, "Medium term oil and gas markets," International Energy Agency, Paris, 2011.
19. EPRINC, "Natural gas Industry fakes the moon landing," briefing memorandum, Energy Policy Research Foundation, Washington, DC, July 1, 2011.
20. EPRINC, "Prospects for LNG exports from North America," presentation at JOGMEC Petroleum Seminar, Tokyo, Feb. 7, 2013.
21. IHS Inc., "America's energy future: the unconventional oil and gas revolution and the US economy," Englewood, Colo., October 2012.
22. Vihma, A., "The shale gas boom," FIIA Briefing Paper 122, Helsinki, February 2013.
23. Hasset., K., and Mathur, A., "Benefits of hydraulic fracking," Oxford Energy Forum, Issue 91, 2013.
24. EIA, "Monthly Energy Review," Energy Information Administration, Washington DC, April 2013.
25. BP PLC, BP Statistical Review of World Energy.
26. Robinson, D., and Qinhua, X., "OIES-Renmin Roundtable Conference on Implications for China of North American Energy Independence: Summary of Discussions," Oxford Institute for Energy Studies and Renmin University of China, Beijing, Mar 27, 2013.
27. Rystad Energy, "North American shale analysis," Oslo, Norway, 2013 (http://www.rystadenergy.com/ResearchProducts/NASAnalysis).
28. CERI, "Canadian oil sands supply costs and development projects 2011-2045," Canadian Energy Research Institute Study 128, 2012, Calgary.
29. IEA," World Energy Outlook," International Energy Agency, Paris, 2012.
30. IEA, "Resources to Reserves," International Energy Agency, Paris, 2013.
31. CAPP, "Canadian natural gas production forecast, Canadian Association of Petroleum Producers, Apr. 13, 2013 (http://www.capp.ca/forecast/Pages/default.aspx).
32. FT, "Chevron back in Argentina with $1.2 billion deal," Financial Times, July 17, 2013.
33. Fan Gao, "Will there be a shale gas revolution in China by 2020?," NG61, Oxford Institute for Energy Studies, April 2012.
The authors

Roberto F. Aguilera is with Curtin University, Australia, and previously was with International Institute for Applied Systems Analysis, University of Vienna, Catholic University of Chile, and Servipetrol. He has participated in the Global Energy Assessment, the NPC study Facing the Hard Truths about Energy, the WPC Guide to Unconventional Gas, and the UN Expert Group on Resource Classification. He has a PhD from Colorado School of Mines and a bachelor's degree from University of Calgary.

Marian Radetzki is professor of economics at Lulea University, Sweden. He has held visiting professorships at Colorado School of Mines and at Catholic University, Santiago, Chile, researching on minerals and energy. Long ago he worked as chief economist at the international copper cartel and has over the years undertaken numerous consultancies. His publication record comprises A Handbook of Primary Commodities in the Global Economy, published in 2008 by Cambridge University Press.