US C3 balances to tighten, prices to rise over winter months
Dan Lippe
Petral Consulting Co.
Houston
Propane supply-demand balances in US markets are poised to be much tighter in winter 2013 than during winters of 2011 and 2012. Tighter supply-demand balances generally result in rising propane prices–unless crude oil prices decline sharply.
Spot propane prices in Mont Belvieu increased 21¢/gal (24%) during second and third quarters 2013 due to the gradual reduction in the inventory surplus. The onset of winter, with forecasts for record high waterborne propane exports, supports Petral Consulting Co.'s forecast for tighter supply-demand balances in fourth-quarter 2013 and first-quarter 2014 and supports forecasts that prices will increase by 15-30¢/gal, but a mild winter (a repeat of winter 2011) would be enough to limit further price increases.
Petral forecasts dated Brent prices will average $100-108/bbl during fourth-quarter 2013 and first-quarter 2014. In second and third quarters 2013, Saudi Arabia increased production by about 1 million b/d to offset supply disruptions in Libya, Syria, and Yemen.
The biggest supply disruption was the strike at Libyan export terminals, but Libya resolved these problems in late September. As exports from Libya return to full rates, Petral expects Saudi Arabia to reduce production as needed to maintain benchmark prices at $100/bbl (±$5-10/bbl).
In the US Gulf Coast ethylene feedstock markets, ethane prices will remain weak but propane prices have not been constrained by weak ethane prices since April. The next trigger point in economic relationships in Gulf Coast ethylene feedstock will occur when variable production costs based on propane reach parity with natural gasoline.
Propane's parity pricing compared with natural gasoline was 135-150¢/gal in second and third quarters 2013 and Petral Consulting forecasts pricing parity vs. natural gasoline will increase to 150-170¢/gal in fourth-quarter 2013 and first-quarter 2014. Spot prices in Mont Belvieu will increase to 115-125¢/gal in fourth-quarter 2013 and 120-140¢/gal in first-quarter 2014.
Inventory surpluses
From end of winter 2011 through end of winter 2012, US and Canadian propane supply hubs carried persistent inventory surpluses.
Surplus inventory in North America was 15.6 million bbl on Apr. 1, 2012, but declined to 11.6 million bbl on Apr. 1, 2013. During this 12-month period, however, North America's inventory surplus compared with the 3-year average varied within a range of 9-12 million bbl but was nearly 21 million bbl on Feb. 1, 2013.
Despite economic incentives of 20-30¢/lb to use more propane as ethylene feedstock (compared with naphtha) and to export propane at maximum rates (60-90¢/gal), supply growth kept pace with the increases in feedstock demand and exports until March 2013. As noted earlier this year (OGJ, June 3, 2013, p. 98), completion of the first of two export terminal expansions in the Houston Ship Channel enabled producers, buyers, and traders to reduce the inventory surplus to less than 3 million bbl on Aug. 1, 2013.
Historically, feedstock demand for propane is an important and predictable balancing element for the overall propane supply-demand balance in North America. When colder weather pushes sales and consumption in the retail markets steadily higher during winter months, ethylene producers in the Gulf Coast generally reduce consumption. This adjustment effectively offsets some of the impact of the seasonal increases in retail demand. These counter balancing trends normally help keep the overall market in balance. Similarly, as consumption in retail markets declines during March through August, feedstock demand generally recovers beginning in March or April. The cumulative impact, however, of sustained growth in gas plant propane production at 80,000-90,000 b/d for nearly 2 years limited the ethylene industry's historic capability to adjust its consumption to maintain a balanced market during 2012 and first-half 2013. Propane markets now require both feedstock demand and waterborne exports to offset supply growth and maintain a balanced market. |
The obvious answer, however, is seldom the whole answer. Equally important, March 2013 was as cold as January and February in key regional markets. As a result, demand for space heating in March was 14 million bbl more than in 2012 and almost 11 million bbl more than the 3-year average.
Residential propane consumers usually operate with minimum inventory in their storage tanks during the last 6-8 weeks of winter (mid-February through end of March). In March and April 2013, consumers responded to the higher levels of space-heating demand primarily by purchasing additional supply from their retailers.
April was also colder than the 5-year average, but many residential consumers had very little propane remaining in their storage tanks in early April. Heating degree-days in April 2013 were 21% more than the 5-year average for East Coast and Midcontinent markets and 61% more for the Gulf Coast market. Residential consumers continued to call for refills to meet lingering winter demand.
Weather, as always, was a major influence on propane markets during the season and offseason.
Feedstock demand
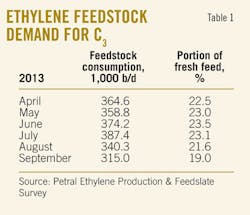
Feedstock demand for propane was 365,800 b/d in second-quarter 2013 and was 32,900 b/d (2.9 million bbl) higher than in second-quarter 2012. The year-to-year increase in ethylene feedstock demand in second-quarter 2013 was about 30% of the volume needed to bring inventory levels down to historic averages if gas plant production had not continued to increase.
Demand averaged about 340,000 b/d in third-quarter 2013 and was only 4,000 b/d higher than in third-quarter 2012. Ethylene feedstock demand for propane did not make any contribution to reducing the inventory surplus in third-quarter 2013.
Propane was consistently less expensive than naphtha feeds during second and third quarters 2013 but was consistently more expensive than ethane. Propane was also more expensive than normal butane for 10 weeks during April through early June.
In an economic environment in which variable production costs for all light feeds (ethane, propane, and normal butane) were consistently 20-30¢/lb less expensive than for heavy feeds (natural gasoline, naphtha, and gas oil), ethylene producers had strong incentives to maintain propane consumption at high levels, but propane lost market share to normal butane during second-quarter 2013.
Fig. 1 summarizes trends in ethylene feedstock demand for propane. Petral Consulting's survey results show total demand for fresh feed was 1.6 million b/d during second and third quarters 2013. We forecast total demand for fresh feed will average 1.60-1.65 million b/d during fourth-quarter 2013 and first-quarter 2014.
The surge in exports, however, will continue unabated during winter 2013. Under our supply-demand forecasts, total propane availability (domestic production, inventory, and imports from Canada) will be insufficient to support continued growth in exports and feedstock demand at July-August levels during winter 2013 if heating degree-days in winter 2013 are near the 5-year average in the Upper Midwest, New England, MidAtlantic, and Southeast markets.
Based on forecasts for propane demand in retail markets and total exports, Petral Consulting forecasts feedstock demand for propane will decline by 80,000 b/d in fourth-quarter 2013 and average 260,000-280,000 b/d during winter 2013.
Fig. 1 shows historic trends in ethylene feedstock demand for propane.
Exports
Prices for fully refrigerated cargoes in international markets declined in April and May but increased in June and in each month during third-quarter 2013. Prices in Mont Belvieu were discounted 45-60¢/gal vs. Saudi contract prices (CP) in second and third quarters 2013. Discounts at Mont Belvieu compared with Saudi CP remained deep enough to boost waterborne exports to record highs beginning in March when Enterprise Products Co. began loading fully refrigerated cargoes at nearly double the rates of 2012.
The US Census Bureau's Foreign Trade Division data showed total US exports (including overland shipments to Mexico) were 285,000 b/d in second-quarter 2013 and were 121,100 b/d more than in second-quarter 2012. Foreign Trade Division statistics and Petral Consulting's estimates show US exports were 320,000-340,000 b/d in third-quarter 2013.
US exports in third-quarter 2013 were about 170,000 b/d more than in third-quarter 2012 and 113,000 b/d more than first-quarter 2013. Propane exports in second and third quarters 2013 were about 26 million bbl more than in second and third quarters 2012. The increase in exports helped reduce the US inventory surplus during spring and summer 2013.
Even though US exports increased by more than 113,000 b/d in third-quarter 2013 compared with first-quarter 2013, Saudi Arabia increased CP every month June through September. The increase in international benchmark prices indicates global demand increased enough to keep pace with growth in US exports.
Incentives to load propane export cargoes will average 40-60¢/gal in fourth-quarter 2013 and 35-45¢/gal in first-quarter 2014. As long as prices in Mont Belvieu are discounted 25-30¢/gal vs. Saudi CP, international LPG buyers and traders will continue to load cargoes at maximum rates during winter 2013.
Propane supply
Data from the US Energy Information Administration (EIA) show total domestic production from gas plants and net propane production from refineries averaged 1.071 million b/d in second-quarter 2013. Production in second-quarter 2013 was 109,800 b/d (10 million bbl) more than year-earlier volumes.
Based on EIA data for July and estimates for August and September 2013, we estimate total domestic production was 1.11-1.12 million b/d in third-quarter 2013. Production in third-quarter 2013 was about 119,000 b/d (10.9 million bbl) more than year-earlier volumes. Petral forecasts total domestic production will be 1.10-1.15 million b/d in fourth-quarter 2013 and first-quarter 2014; total production in winter 2013 will be 85,000-100,000 b/d (15-18 million bbl) more than in winter 2012.
Gas plants
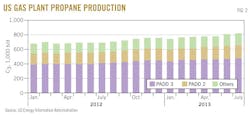
EIA statistics show gas plant propane production averaged 787,800 b/d in second-quarter 2013. Production was 97,100 b/d (8.8 million bbl) more than in second-quarter 2012 and accounted for all of the year-to-year increase in domestic production. EIA statistics show gas plant production in July 2013 averaged 820,200 b/d and was 124,000 b/d more than in 2012.
Petral Consulting estimates production averaged 805,000-815,000 b/d in third-quarter 2012 and was 95,000-105,000 b/d (about 9.3 million bbl) more than in third-quarter 2012. Finally, we forecast gas plant production will average 800,000-820,000 b/d in fourth-quarter 2013 and 820,000-840,000 b/d in first-quarter 2014.
Fig. 2 shows trends in propane production from gas plants.
Refineries
For second-quarter 2013, EIA statistics showed propane production from refineries (net of propylene for propylene chemicals markets) was 283,000 b/d; net production was 12,700 b/d more than in second-quarter 2012 and 17,600 b/d more than in first-quarter 2013.
For third-quarter 2013 (based on EIA statistics for July and Petral Consulting estimates for August and September), refinery propane production was 290,000-300,000 b/d.
We forecast purity propane supply from refineries will average 290,000-300,000 b/d for fourth-quarter 2013 and first-quarter 2014.
During 2006-08, propane imports from Canada typically averaged 75,000-90,000 b/d during second and third quarters. Imports from Canada during second and third quarters 2009-11 declined to 65,000-75,000 b/d. During 2006-08, waterborne deliveries to East Coast import terminals declined during second and third quarters and were 20,000-25,000 b/d. Waterborne imports through East Coast terminals during second and third quarters 2011 were 12,800 b/d, but East Coast import terminals have not received a single cargo since April 2012. Growth in gas plant production in Pennsylvania, Ohio, and West Virginia will continue to reduce the need for imports during second and third quarters 2014, but the seasonal increase in demand in retail markets will require large imports from eastern Canada in winter 2013. |
Fig. 3 shows trends in total propane production (gas plants and refineries).
Imports
Based on data published by the Foreign Trade Division for second-quarter 2013, imports were 71,600 b/d, all from Canada. Total imports were equal to year-earlier volumes. In third-quarter 2013, based on Foreign Trade Division's statistics for July and Petral estimates for August and September, imports were 85,000-95,000 b/d and were about 10,000 b/d less than in third-quarter 2012.
Petral Consulting forecasts imports into the US will average 130,000-150,000 b/d in fourth-quarter 2013 and first-quarter 2014.
Inventory trends
Propane inventory (excluding non-fuel propylene inventory included in EIA gross propane-propylene inventory data) in primary storage in the US was 37.3 million bbl on Apr. 1, 2013. EIA statistics from the Petroleum Supply Monthly (PSM) showed inventory on Apr. 1 was 3.6 million bbl less than year-earlier volumes but was 9.0 million bbl more than the 3-year average.
In a typical offseason (second and third quarters), inventory increased 34-35 million bbl, and the seasonal build was never less than 33.5 million bbl (2006-11) until offseason 2013.
Based on EIA statistics published in PSM (data through July) and weekly survey results, we estimate inventory accumulation during offseason 2013 was about 24-27 million bbl (7-10 million bbl less than the 3-year average). Usually, inventory begins to build in late March or early April, but inventory continued to decline during most of April due to colder than average temperatures in retail markets east of the Rocky Mountains.
Inventory accumulation during the last half of April was a bare 240,000 bbl vs. the 3-year average 5.4 million bbl. Differences between the 3-year average for March and April and actual build rates for 2013 were 12.1 million bbl.
Just as abnormally warm weather during winter 2011 resulted in surplus inventory, 4-6 weeks of abnormally cool weather at the end of winter 2012 resulted in total withdrawals from primary storage at double the volume of the previous winter.
Inventory (excluding non-fuel propylene) on Aug. 1 was 56.6 million bbl (EIA data from PSM for July 2013). Inventory was 2.1 million bbl more than the 3-year average but 7.7 million bbl less than in 2012. The comparison with the 3-year average is more important than the comparison with 2012 because inventory in 2012 was consistently more than historic averages from Jan. 1 through Dec. 31.
Inventory in Canada typically begins to increase in March and reaches its seasonal peak on Sept. 1 or Oct. 1. In 2013, however, inventory declined in March and did not begin the seasonal build until April.
Statistics from Canada's National Energy Board (NEB) showed inventory (purity propane only) on Apr. 1 was 1.02 million bbl. Inventory increased by 8 million bbl during April through August and was 9.0 million bbl on Sept. 1. Seasonal accumulation rates were 7.9 million bbl in 2011 and 9.2-9.4 million bbl in 2009 and 2010.
NEB statistics showed inventory in Canadian storage on Apr. 1 was 1.2 million bbl less than the 3-year average and 4 million bbl less than in 2012.
Based on typical seasonal build rates of 8-9 million bbl, Canadian propane marketers could reasonably expect that inventory of purity propane would increase to a peak of 9-10 million bbl. After April, seasonal build rates were average or slightly more than average.
NEB data show Canadian inventory in underground storage reached a peak of almost 9.5 million bbl on Oct. 1. At this level, inventory was equal to the 3-year average but was 1.2 million bbl less than in 2012.
Fig. 4 shows trends in propane inventory in US storage.
Regional trends
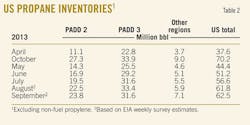
Table 2 presents trends in regional propane inventory.
EIA statistics showed 9.6 million bbl of propane inventory remained in primary storage in US Petroleum Administration for Defense District (PADD) 2 on Apr. 1, 2013. (See accompanying box for PADD regions.)
Inventory on Apr. 1 was 7.4 million bbl less than year-earlier volumes and 1.3 million bbl less than the 3-year average. In contrast to inventory at the end of winter 2011, PADD 2 storage had no surplus inventory at the end of winter 2012.
Inventory build during second-quarter 2013 was 7.4 million bbl (about 45% of typical total seasonal accumulation). Based on EIA monthly statistics in PSM for July and weekly data for August and September, Petral estimates inventory increased 6.0-6.5 million bbl during third-quarter 2013 and the total seasonal build was 13.5-14.0 million bbl.
Petral estimates inventory in PADD 2 reached a peak of 23-24 million bbl (Oct. 1 or Nov. 1). At this level, inventory in PADD 2 storage was 4 million bbl less than in 2012 and 3.5-4.0 million bbl less than the 3-year average. Peak inventory in PADD 2 storage at the beginning of winter 2013 was less than any previous seasonal peak since 2008.
EIA statistics showed inventory in primary storage in PADD 3 (excluding non-fuel propylene) fell to its seasonal minimum of 22.8 million bbl on May 1 (2 months later than usual). Inventory on May 1 was only 0.6 million bbl more than in 2012 but was 6.2 million bbl more than the 3-year average.
EIA's monthly statistics showed inventory accumulation in PADD 3 storage was 3.7 million bbl in second-quarter 2013. The 3-year average for second quarter was 9.1 million bbl. We estimate inventory increased 3-4 million bbl in third-quarter 2013 and was in line with the 3-year average of 3.6 million bbl.
On Aug. 1, 2013, inventory in PADD 3 storage was 31.6 million bbl, according to EIA statistics in PSM. At this level, inventory was already more than seasonal peak volumes in 2010 and 2011.
Typically, inventory in PADD 3 continues to build during August and September, but EIA weekly statistical reports showed almost no increase in inventory in PADD 3 during August and September 2013. Weekly statistical reports show inventory in PADD 3 reached a seasonal peak of 31-33 million bbl on Oct. 1. Inventory on Oct. 1 was about the same as in 2012 but remained 5 million bbl more than the 3-year average.
Pricing, economics
Spot prices for dated Brent averaged $100-103/bbl during second-quarter 2013 but rebounded in third-quarter 2013 and averaged $108-112/bbl. Second-quarter 2013 was relatively quiet with little new turmoil in the Middle East, but the civil war in Syria escalated in third-quarter 2013 and workers at Libya's oil export terminals went on strike for better working conditions.
The unexpected loss of supply from Libya sparked the increase in benchmark crude oil prices during third-quarter 2013.
EIA statistics show Saudi Arabia increased production by 500,000 b/d in second-quarter 2013 and continued to increase production in third-quarter 2013. Production in Libya began to recover to pre-strike levels during the last 2 weeks of September.
Propane prices increased to 93-94¢/gal in April and May but fell to 86¢/gal in June. Price ratios compared with dated Brent were 38% in April and May 2013 but fell to 35% in June. Price ratios compared with dated Brent were higher in second-quarter 2013 than in first-quarter 2013 (32%) but were about the same as in second-quarter 2012.
Ethylene production costs were 11-12¢/lb in second-quarter 2013 and were double production costs in first-quarter 2013. Additionally, production costs based on propane were 3¢/lb more than production costs based on ethane, but propane provided ethylene producers with economic incentives of 25-30¢/lb compared with natural gasoline and gas oil in second-quarter 2013.
The increases in production costs in second-quarter 2013 confirmed rising price ratios compared with dated Brent were due to stronger spot prices in Mont Belvieu and not the result of weaker crude oil prices.
In third-quarter 2013, prices increased to 110-115¢/gal in September from 90-95¢/gal in July and averaged 103¢/gal. Ratios compared with dated Brent were 36% in July and increased to 40-42% in July and August. Furthermore, ethylene production costs based on propane doubled again in third-quarter 2013 and were 23-24¢/lb in September vs. 11-12¢/lb in July. This shift shows propane prices were much stronger in third-quarter 2013 than in second-quarter 2013.
The author
Daniel L. Lippe ([email protected]) is president of Petral Consulting Co., which he founded in 1988. He has expertise in economic analysis of a broad spectrum of petroleum products including crude oil and refined products, natural gas, natural gas liquids, other ethylene feedstocks, and primary petrochemicals.
Lippe began his professional career in 1974 with Diamond Shamrock Chemical Co., moved into professional consulting in 1979, and has served petroleum, midstream, and petrochemical industry clients since. He holds a BS (1974) in chemical engineering from Texas A&M University and an MBA (1981) from Houston Baptist University. He is an active member of the Gas Processors Suppliers Association and serves on GPA's NGL Market Information Committee.


