Dan Lippe
Petral Worldwide Inc.
Houston
According to mainstream media, US economic activity was measurably slower during first-half 2011. According to statistics published by the US Department of Commerce's Bureau of Economic Analysis, however, gross domestic product growth (based on GDP measured in current dollars) averaged 4.2% in 2010. GDP growth averaged 4.5% for first-quarter 2011 and 3.7% for second-quarter 2011.
From this point of view, US economic activity remained on the positive side of the ledger during first and second quarters 2011 but was slightly weaker than the 2010 average.
BEA also publishes GDP statistics in inflation-adjusted dollars. This statistic, generally widely reported and quoted, showed almost no growth in US GDP for second-quarter 2011. Estimates of inflation, however, are also subject to revision and these revisions will affect BEA's estimates of "real" GDP for first and second quarters 2011.
Ethylene production averaged 147.3 million lb/day for first-quarter 2011 and was 3.9% higher than in first-quarter 2010. Production averaged 144.1 million lb/day for second-quarter 2011 and was 2.4% higher than in second-quarter 2010. The year-to-year growth in ethylene production was weaker in second-quarter 2011 than in first-quarter 2011, but operating problems and turnarounds accounted for most of the quarter-to-quarter decline.
Even though GDP in "inflation adjusted terms" showed nearly zero growth in second-quarter 2011, ethylene production, a very accurate measure of ethylene demand, continued to show year-to-year growth and was equal to prerecession volumes for the first time since the recovery began.
Finally, ethylene producers also continued to use ethane for an historically high percentage of total ethylene production during first and second quarters 2011. A surge in propylene prices, however, caused ethane to lose its cost advantages compare with propane and gas oil for a few weeks during second-quarter 2011.
Feed slate trends
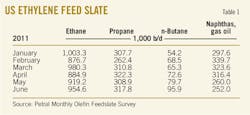
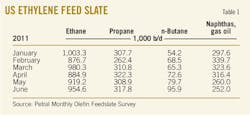
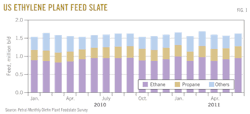
Petral's monthly survey results showed the ethylene industry's demand for fresh feed averaged 1.63 million b/d for first-quarter 2011 but declined to 1.60 million b/d for second-quarter 2011. Demand for fresh feed in first-quarter 2011 was 46,000 b/d higher (2.88%) than in first-quarter 2010.
Demand in second-quarter 2011 was 48,000 b/d higher than in second-quarter 2010 (3.1%). Despite the year-to-year increase during first and second quarters 2011, demand for fresh feed remained 30,000 b/d (1.8%) lower than prerecession levels of first-half 2008, but ethylene production averaged 146 million lb/day and was equal to prerecession levels.
According to Petral survey results, demand for LPG feeds (ethane, propane, and normal butane) averaged 1.31 million b/d during first-quarter 2011 and increased to 1.32 million b/d during second-quarter 2011. Demand for LPG feed in first-quarter 2011 was 120,500 b/d (10.1%) higher than in first-quarter 2010 and 65,000 b/d (5.4%) higher than in fourth-quarter 2010.
Demand for LPG feed in second-quarter 2011 was only 15,000 b/d (1.1%) higher than in first-quarter 2011 but was 69,600 b/d (5.5%) higher than for second-quarter 2010. Demand for LPG feeds during first and second quarters 2011 was also 105,000 b/d (8.7%) higher than prerecession volumes.
In the primary petrochemicals industry, the increase in LPG demand is a better indicator of continued recovery than total feedstock demand. This is true because ethane has a much higher yield to ethylene, and producers consume less total feed to produce an equivalent volume of ethylene.
LPG feeds accounted for 80% of total fresh feed in first-quarter 2011 and 83% in the second-quarter 2011. For 2005-07, LPG feeds accounted for only 70% total fresh feed.
After 8 consecutive-quarters of year-to-year increases in demand, ethylene producers maintained ethane consumption at high levels but demand reached a temporary plateau in second-quarter 2011. Ethane's share of total fresh feed averaged 58% during first and second quarters 2011 compared with 59% during fourth-quarter 2010. Ethane temporarily lost its economic advantages compared with propane and gas oil during second-quarter 2011; this factor contributed to the temporary decline in demand during April and May.
Operating rates for LPG crackers averaged 95% of capacity during first-quarter 2011, but average operating rates slipped to 91% during second-quarter 2011. Ethane accounted for 81% of fresh feed during first and second quarters 2011 compared with 80% during fourth-quarter 2010.
Operating rates for multifeed crackers improved during first-quarter 2011 averaged 88% but slipped to 87% during second-quarter 2011. Finally, ethane accounted for 46% of fresh feed for multifeed crackers during first-quarter 2011 but only 44% during second-quarter 2011.
If resolution of the debt-ceiling crisis restores confidence in future economic growth, GDP growth may rebound during third and fourth quarters 2011. If GDP growth is stronger, demand growth for petrochemicals will also most likely be stronger during second-half 2011. On this basis, Petral Worldwide forecasts ethylene plants in the US to operate at 86-90% of nameplate capacity. Petral Worldwide also forecasts demand for fresh feed will average 1.62-1.65 million b/d during third and fourth quarters 2011.
We forecast demand for LPG feeds will average 1.20-1.25 million b/d during third and fourth quarters 2011, and ethane will continue to account for 57-58% of industry feed.
Fig. 1 illustrates historic trends in ethylene feed.
US ethylene production
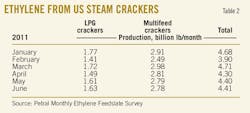
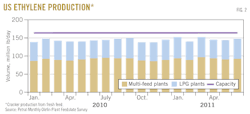
Petral's survey results showed ethylene production from olefin plants totaled 13.3 billion lb in first-quarter 2011. Survey results showed production was slightly lower in second-quarter 2011, totaling 13.1 billion lb. Ethylene production from steam crackers in first-quarter 2011 was 534 million lb higher than in first-quarter 2010 and was 451 million lb more than in fourth-quarter 2010.
Production in second-quarter 2011 was 346 million lb higher than in second-quarter 2010, but was 129 million lb lower than in first-quarter 2011.
Production from LPG plants totaled 4.90 billion lb in first-quarter 2011 and 4.73 billion lb in second-quarter 2011. LPG plants produced 160.2 million lb more ethylene than in first-quarter 2010 and 171.3 million lb more than in fourth-quarter 2010. During second-quarter 2011, LPG plants produced 186 million lb more than during second-quarter 2010 but produced 177.7 million lb less than in first-quarter 2011. Operating problems and turnaround activity accounted for the quarter-to-quarter decline in production during second-quarter 2011.
Ethylene production from multifeed crackers totaled 8.39 billion lb during first-quarter 2011 and 8.43 billion lb in second-quarter 2011. Production from multifeed crackers during first-quarter 2011 was 374 million lb more than during first-quarter 2010 and 280 million lb more than in fourth-quarter 2010. Production in second-quarter 2011 was 160 million lb more than during second-quarter 2010 and was 49 million lb more than during first-quarter 2011.
Petral Worldwide forecasts LPG crackers will operate 93-95% capacity during third and fourth quarters 2011. The balance of production, about 17 billion lb, will come from multifeed plants.
Fig. 2 shows trends in ethylene production.
US propylene production
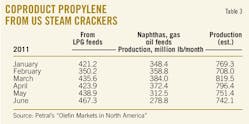
Although ethane's share of industry feed remained historically high during first and second quarters 2011, higher operating rates in multifeed plants in first-quarter 2011 resulted in increased use of propane and heavy feeds. As a result, coproduct propylene from ethylene plants was higher in first-quarter 2011 than in fourth-quarter 2010.
Coproduct propylene supply totaled 2.30 billion lb in first-quarter 2011 and was 134 million lb (5.9%) more than in fourth-quarter 2010, but coproduct supply was 100 million lb less than in first-quarter 2010. Total industry operating rates were slightly lower in second-quarter 2011 but coproduct propylene supply was again 2.30 billion lb. The temporary shift from ethane to other feeds was enough to offset the decline in operating rates.
Propylene production from LPG feeds totaled 1.21 billion lb in first-quarter 2011 and 1.35 billion lb in second-quarter 2011. Production from LPG feeds in first-quarter 2011 was 144 million lb more than in first-quarter 2010. Production from LPG feeds in second-quarter 2011 was 154 million lb more than in second-quarter 2010.
Propylene production from heavy feeds totaled 1.09 billion lb in first-quarter 2011 but declined during second-quarter 2011, totaling 0.97 billion lb. Production from heavy feeds dropped by 245 million lb in first-quarter 2011, compared with first-quarter 2010, and was 67 million lb lower in second-quarter 2011 than in second-quarter 2010.
Refinery propylene supply
Refinery propylene sales into the merchant market are a function of fluid catalytic cracking unit feed rates, FCCU operating severity, and economic incentives to sell propylene rather than use it as alkylate feed. Normally, refineries reduce FCCU feed rates during fourth and first quarters. Propylene yields from FCCUs are generally lower during first and fourth quarters because refiners operate FCCUs at lower severity to increase refinery yields of distillate fuel oil.
EIA reported FCCU feed for refineries in the US Gulf Coast and Midcontinent was 3.40 million b/d for first-quarter 2011, or 33,000 b/d less than during fourth-quarter 2010. FCCU feed averaged 32.7% of crude runs. In second-quarter 2011, EIA statistics indicate FCCU feed increased 218,000 b/d and averaged 3.62 million b/d, or 33.6% of refinery crude runs.
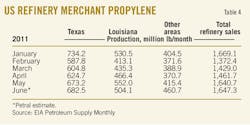
Beginning in January 2010, a few refining companies with plants on the Texas Gulf Coast, South Louisiana, and the upper Midwest changed how they reported the composition of propane-propylene streams to the US Energy Information Administration. These changes had affected the reported volume of refinery propylene supply. Based on extensive discussions with EIA personnel, these refineries reported their propane-propylene streams to EIA as 100% propylene for most of 2010 and during January and February 2011. Statistics for March through May 2011 were within a reasonable range.This topic is an important subject of discussion by the NGL Market Information Committee of the Gas Processors Association and between the committee and the EIA. Until this issue is resolved, misreporting will continue to create uncertainty in the EIA statistics for refinery propylene supply |
According to statistics from the US Energy Information Administration, refinery-grade propylene production totaled 4.47 billion lb in first-quarter 2011 and increased to 4.75 billion lb in second-quarter 2011. Refineries produced 221 million lb less during first-quarter 2011 than in fourth-quarter 2010 (based on unadjusted EIA statistics), and they produced 279 million lb more in second-quarter 2011 than in first-quarter 2011.
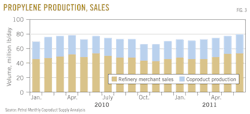
Based on EIA statistics (as published) for refinery-grade propylene and Petral's estimates for coproduct supply, US propylene supply increased in first-quarter 2011, totaling 6.76 billion lb. Total propylene supply increased again in second-quarter 2011, totaling 7.10 billion lb. Domestic production in first-quarter 2011 was 521 million lb more than in fourth-quarter 2010 and production in second-quarter 2011 was 261million lb more than in first-quarter 2011.
Fig. 3 shows trends in coproduct and refinery merchant propylene sales (as reported by EIA).
Ethylene economics, pricing
Ethane and propane accounted for about 81% of total ethylene production in first and second quarters 2011. Industry's average production costs were again primarily determined by production costs for ethane and propane.
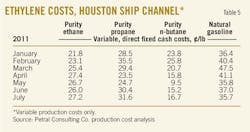
Production costs for ethylene in the Houston Ship Channel (assuming full spot prices for all coproducts) based on purity-ethane feeds averaged about 23¢/lb in first-quarter 2011 and increased to 27¢/lb in second-quarter 2011. Production costs based on ethane for first-quarter 2011 were unchanged compared with fourth-quarter 2010. In first-quarter 2011, purity ethane provided ethylene producers with cost savings of 15-22¢/lb compared with natural gasoline. In second-quarter 2011, incentives to maximize ethane consumption compared with natural gasoline narrowed to 9-14¢/lb.
Production costs for purity propane averaged 31¢/lb in first-quarter 2011 but declined in second-quarter 2011 and averaged 26¢/lb. Although variable production was consistently higher than ethane, propane provided ethylene producers with a cost savings of 5-8¢/lb compared with natural gasoline in January and February, but propane's cost advantage widened to 18¢/lb in March. In second-quarter 2011, propane's cost advantage compared with natural gasoline narrowed from 18¢/lb in April to 7¢/lb in June.
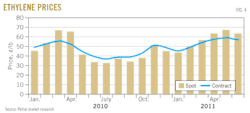
Ethylene producers experienced various operating problems during March through May. These problems sparked a strong rally and spot ethylene prices increased to a year-to-date peak of 67¢/lb in May from 43¢/lb in January and 49¢/lb in February. Ethylene producers resolved operating problems and completed turnarounds by the end of May. As a result, spot prices for ethylene declined to 63¢/lb in June and 59¢/lb in July.
Trends in contract benchmark prices indicate ethylene producers recognized the various problems were temporary but they were able to increase the contract benchmark to 57-58¢/lb for second-quarter 2011, compared with 54¢/lb for March.
For first-quarter 2011, spot prices averaged 49.5¢/lb, or 5.1¢/lb higher than the fourth-quarter 2010 average, according to PetroChem Wire (www.petrochemwire.com). The contract benchmark averaged 49.3¢/lb, or 2¢/lb higher than in fourth-quarter 2010. For second-quarter 2011, spot prices averaged 64.3¢/lb and were 14.8¢/lb higher than in first-quarter 2011. Contract benchmark prices averaged 57.5¢/lb and were 8.2¢/lb higher than for first-quarter 2011.
Feedstock prices, coproduct values, and ethylene plant yields determine ethylene production costs. Petral maintains direct contact with the olefin industry and tracks historic trends in spot prices for ethylene and propylene. We use a variety of sources to track trends in feedstock prices. Some ethylene plants have the necessary process units to convert all coproducts to purity streams. Some ethylene plants, however, do not have the capability to upgrade mixed or crude streams of various coproducts and sell some or all their coproducts at discounted prices. We evaluate ethylene production costs in this article based on all coproducts valued at spot prices. |
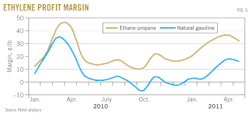
Margins based on the contract benchmark prices were stronger for all feedstocks in first-quarter 2011 than in fourth-quarter 2010. Margins based on purity-ethane production costs averaged 26¢/lb, compared with 24¢/lb for fourth-quarter 2010. Margins based on propane averaged 18¢/lb and were 3¢/lb higher than in fourth-quarter 2010.
Margins for ethylene production based on natural gasoline and light naphtha remained lower than margins for ethane and propane but these also improved. Profit margins for natural gasoline averaged 8¢/lb in first-quarter 2011, compared with 6¢/lb in fourth-quarter 2010.
For second-quarter 2011, margins based on contract benchmark prices improved further for all feedstocks. Margins averaged 31¢/lb for purity ethane, 31¢/lb for propane, and 20¢/lb for natural gasoline.
Profit margins based on the contract benchmark are usually stronger than margins based on spot ethylene prices. Margins based on spot ethylene prices were equal to margins based on the contract benchmark price during first-quarter 2011. The surge in spot ethylene prices during second-quarter 2011 boosted margins to higher levels.
Profit margins based on spot ethylene prices and purity-ethane production costs averaged 36¢/lb in second-quarter 2011, or 6¢/lb higher than the contract benchmark margin. Similarly, the spot price margin based on propane averaged 38¢/lb in fourth-quarter 2010, or 7¢/lb higher than the contract benchmark margin. Natural gasoline yielded a margin of 26¢/lb for second-quarter 2011, also 7¢/lb higher than margins based on the ethylene contract benchmark price.
Ethylene production costs for some ethylene are based on sales of coproducts at discounted prices. Margins for natural gasoline based on discounted prices for coproducts were 5¢/lb belowbreak even in first-quarter 2011 but improved to 3.5¢/lb for second-quarter 2011.
Fig. 4 shows historic trends in ethylene prices (spot prices and net transaction prices); Fig. 5 illustrates profit margins based on contract ethylene prices and composite production costs.
Refinery, polymer-grade propylene pricing
During first-quarter 2011, spot prices for refinery-grade propylene (RGP) fluctuated within 67-72¢/lb. Consistent with the seasonal decline in RGP supply, the average for first-quarter 2011 was about 18¢/lb higher than for fourth-quarter 2010. The price premium for RGP compared with unleaded regular gasoline was 28¢/lb for first-quarter 2011 and was 11.5¢/lb higher than during fourth-quarter 2010.
Spot prices for refinery-grade propylene jumped on a roller coaster during April-May. Prices in late March were 78-80¢/lb. Spot prices for RGP surged to 92¢/lb in late April-early May and then collapsed during May. Prices in late May were again 78-80¢/lb.
The premium for refinery-grade propylene prices compared with unleaded regular gasoline prices was 25¢/lb in late March. The premium reached a peak of 33-35¢/lb in late April and early May and narrowed to 17¢/lb in late May. During June and July, premiums for refinery-grade propylene compared with unleaded regular gasoline were 17-22¢/lb.
Inventory trends for refinery-grade propylene provided some support for stronger spot prices during March and April 2011. In late February, RGP inventory totaled 473 million lb, according to EIA weekly inventory statistics. By early April, RGP inventory declined 195 million lb, or 41%, and totaled only 278 million lb. The decline in inventory probably sparked the surge in spot prices during April-May.
Production of polymer-grade propylene from the new propane dehydrogenation plant became a more consistent source of supply during first and second quarters 2011. Spot prices for polymer-grade propylene averaged about 74¢/lb for first-quarter 2011 and were about 2¢/lb lower than the average for the contract benchmark.
During the price spike for refinery-grade propylene in April and May, polymer-grade propylene sellers were able to increase the contract benchmark to 97¢/lb for May, compared with 72¢/lb in March. Spot prices for polymer-grade propylene, however, averaged about 90¢/lb in April and May and were 85¢/lb for second-quarter 2011.
Premiums for contract polymer-grade propylene compared with refinery-grade propylene were 6.3¢/lb for first-quarter 2011 and widened to about 10¢/lb for second-quarter 2011. The premium reached a peak of about 14¢/lb in May but was 11¢/lb in June and slipped to 10¢/lb in July.
Second-half 2011 outlook
Civil unrest in Egypt and Libya sparked a significant rally in crude oil prices beginning in February. Turmoil in Egypt had almost no direct impact on crude oil supply-demand balances but increased traders' perceptions of supply risk. Turmoil in Libya directly disrupted crude oil production and exports seemingly indefinitely and clearly justified a heightened perception of supply risk.
As a result, spot prices for WTI at Cushing increased to $103/bbl in March and were $14/bbl higher than in January. More significantly, spot prices for dated Brent averaged $114.6/bbl in March and were $18/bbl higher than in January.
Typical price differentials between WTI and all other global price benchmarks broke down during first-quarter 2011. Most published sources attributed the widening discounts for WTI compared with dated Brent and other price benchmarks to completion of Keystone Phase 2 and expectations of ever-growing inventory surpluses at Cushing. Inventory at Cushing at the end of February, however, was only 39.6 million bbl, only 1.7 million bbl higher than at the end of December.
EIA statistics showed inventory increased to 42.3 million bbl at the end of March but subsequently declined to 39.3 million bbl at the end of May. Cushing has an estimated storage capacity of about 55 million bbl; so storage capacity utilization was only 77% in March and slipped to 71% in May.
Even though the unusually deep price discounts for WTI sparked a miniboom in crude oil shipments from Cushing via rail and barges, price discounts for WTI compared with dated Brent and the Organization of Petroleum Exporting Countries basket price widened further during second-quarter 2011.
As result, we now use the basket crude oil price from OPEC as the basis for forecasts for naphtha, motor gasoline, and distillate fuel oil prices. Forecasts for refined-product prices are the key parameters that determine ethylene production costs and feedstock parity values. Petral forecasts OPEC basket prices will average $105-115/bbl during third and fourth quarters 2011.
We expect light naphtha and natural gasoline will remain the high-cost feedstocks for Gulf Coast ethylene production during third and fourth quarters 2011. Price forecasts indicate variable production costs for natural gasoline will average 55-65¢/lb, and we forecast spot ethylene prices will average 60-65¢/lb during third and fourth quarters 2011.
Petral forecasts indicate ethylene production costs based on purity ethane will average 28-30¢/lb during third and fourth quarters 2011. Forecasts also indicate production costs based on purity propane will average 32-43¢/lb during third-quarter 2011 and will increase to 36-48¢/lb during fourth-quarter 2011. Profit margins based on spot ethylene prices will average 30-32¢/lb for purity ethane and 14-30¢/lb for purity propane.
Petral forecasts polymer-grade propylene will average 75-82¢/lb during third and fourth quarters 2011. Based on differentials of 5-8¢/lb, refinery-grade propylene prices will average 70-75¢/lb during third and fourth quarters 2011. OGJ
The author
More Oil & Gas Journal Current Issue Articles
More Oil & Gas Journal Archives Issue Articles
View Oil and Gas Articles on PennEnergy.com
