James M. Fausnaugh
geotech.org
Littleton, Colo.
Surface geochemical surveys are often dismissed due to the idea that intervening stratigraphy may block or prevent upwardly moving hydrocarbons from passing through them.
Many of the published analogs given as examples of seepage alteration phenomena predominantly show the surface effects and little of the geochemical changes that occur between the reservoir and the surface. The types and causes of surface alteration phenomena have been discussed at length.1-4
In 1994 an opportunity arose to run a significant analog using several exploration techniques that would allow the detection of seepage phenomena throughout the stratigraphic column. Of interest here is the use of electrical methods.5
Electrical measurements of oil and gas reservoirs have been utilized in exploration for decades, from well logging tools to deep sensing electromagnetic surveys. Methods discussed are Long Offset Time Domain Electromagnetics (LOTEM) for measuring deep resistivity, noncontact electromagnetic induction for measuring near surface soil electrical conductivity, and conductivity measurements related to near surface soil salinity.
Units for all methods used for the study are reported as resistivity or conductivity. Through statistical reinterpretation of the data, the following discussion is presented with the intent of giving some insight as to how these tools can detect hydrocarbon seepage alteration and directly link measurable surface anomalies to the reservoir at depth.
Sorrento field surveys
The purpose of the Sorrento field survey was to evaluate new seismic tools and interpretive methods being developed at the time.
The combination of 3D seismic, a geochemical survey, well log analysis, and the LOTEM survey offered an opportunity to study hydrocarbon microseepage and associated alteration phenomena as a controlled, well documented analog.
The LOTEM survey had 38 receiver locations coincident with one of the 3D seismic lines acquired as part of the field study. A 647 sample surface geochemical survey was also run along the source lines of the seismic survey.3 6
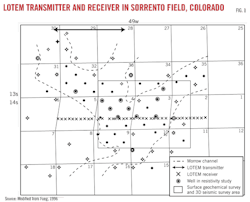
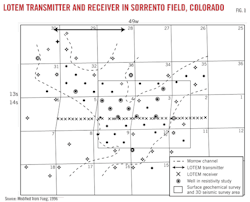
Sorrento field covers 3,200 acres in 13s and 14s-49w, Cheyenne County, Colo., at the southeastern extent of the Denver basin (Fig. 1). Production is predominantly from channel sandstones that form part of the Pennsylvanian Morrow formation. These sandstones occur at a depth of about 5,500 ft and reach a maximum thickness of 62 ft. Secs. 3 and 4 of Sorrento field are the primary areas of investigation for the LOTEM Survey.5 7
LOTEM measurements require the input of a repetitive waveform signal containing a broad band of frequencies. As the electrical current flows through the transmitter, it produces a magnetic field.
When the transmitter is switched off, eddy currents are induced in the ground that try to maintain the same magnetic field that was present during the primary current flow. These eddy currents diffuse into the ground as time increases and the intensity and duration of these eddy currents depend on the electrical properties of the subsurface.
The eddy currents result in a secondary magnetic field that induces a current equivalent to soil conductivity that is detected at the receiver.5 8 The LOTEM survey across Sorrento Field establishes a resistivity anomaly that corresponds to oil production in Secs. 3 and 4. Fig. 2 shows the location of the LOTEM resistivity anomaly.
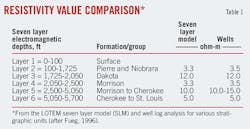
A seven layer resistivity model was chosen to estimate the electromagnetic profiles at depth because it yielded the smallest errors and the smoothest curves.5 Layers 3, 4, and 5 exhibit consistent resistivity lows while Layers 1, 2, and 6 yielded highs relative to the detected anomaly. The anomalies in Layers 3, 4, and 5 correspond to depths of 1,725 ft to 5,050 ft.
Even with the inconsistent resistivity highs and lows, the LOTEM anomaly is present and can be interpreted by analyzing the noise associated with each layer. Each layer data set was statistically transformed, differentiated by the Central Difference method, and visually compared.
The results show that the signal on the west side of the LOTEM traverse yields less noise than that of the east side. The large departure at the center of the traverse is a fault that helps compartmentalize the oil field production in Sec. 4 (Fig. 3).
Well log analysis results
The second electrical tool in the field investigation was well log analysis. Fourteen wells were chosen within the field limits as well as outside the channel boundaries, each analyzed for resistivity.
As with the LOTEM method the logging tool resistivity is measured using a transmitter that induces currents in the earth, creating a secondary magnetic field that is detected as a voltage at the receiver.
Unlike the LOTEM survey, the overall signal penetrates to only 1.5 m of the sonde.
Log resistivity from various formations was calculated from cumulative conductance slope plots used to compare geoelectrical boundaries in the stratigraphic column.5 Comparison of the slope plots of the dry holes and producing wells exhibit some differences in conductance slope.
To better show the differences and how they might be related to vertical seepage, resistivity values calculated from the cumulative conductance slope data were converted to z-transform values and plotted in map view. A resistivity anomaly of uniform low to moderate values above the mean develops over the better-producing part of the field (Sec. 4) west of the sealing fault (Fig. 2).
Random on again, off again, high then low readings occur in the poorer producing zone east of the sealing fault (Sec. 3). Wells here produce from a lower porosity reservoir, are close to linear features, or are outside the channel boundaries.
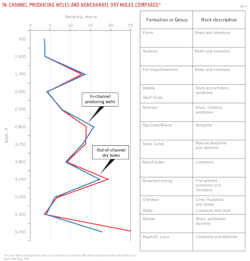
A comparison of the average resistivity for producing wells and dry holes exhibits increases in the zones above the Morrow that gradually decrease upwards through the stratigraphic column towards the surface (Fig. 4 and Table 1). The most notable change occurs at a depth of 3,250 ft where the resistivity from the "in channel" wells is less than that of the "out of channel" wells.
Based on the general stratigraphic descriptions, this is where the rock progression tends toward more diverse groups of dolomite, limestone, sandstone, and shale rather than the repetitive shallower limestone-shale sequence.
Analysis of well logs within the Morrow channel and those outside the valley fill exhibit minute changes in formation character but yield consistent low noise signals within the better producing portion of the field relative to the poorer producing parts. This, coupled with the decreasing resistivity towards the surface, indicates that the LOTEM resistivity anomaly is not a result of lithology changes but rather a sensitivity to bulk changes in resistivity.5
Bulk resistivity changes could be related to the saturation of zones above the reservoir by seeping low molecular weight hydrocarbons, secondary carbonate precipitation due to interactions between in situ organics and seeping hydrocarbons, or organic-inorganic reactions within the numerous intervening mineral assemblages and chemical regimes between the reservoir and the surface.
As demonstrated, the hydrocarbon alteration processes may result in either a high or low resistivity. Theories as to possible alteration mechanisms have been described.4 8 One theory relies on the idea that seepage of hydrocarbons from the reservoir results in a reducing environment above the reservoir.
The presence of anaerobic conditions allows sulfate-reducing bacteria to grow if there is enough sulfate ion and organic material. These bacteria reduce sulfate ions in pore water to the reduced sulfur species, pyrite as an example, and oxidize the organic carbon to the bicarbonate ion (HCO3–). The bicarbonate ion can react with calcium to form carbonate cement. This will reduce the porosity and will result in a higher resistivity. Conversely, the pyrite could produce an electrical conductivity anomaly.
Carbon dioxide, a metabolic by-product of microbial activity, can form carbonic acid when mixed with water. Once dissolved, carbon dioxide is converted into bicarbonate ions or carbonate (CO32–) ions. Certain forms of sea life biologically fix bicarbonate with calcium (Ca+2) to produce calcium carbonate (CaCO3).
A third option is the precipitation of carbonates with organic ligands. Calcium ion precipitates with complex organic anions, resulting in carbonates with a poorly define crystal structure. The calcium ion forms intermediate to strong, low solubility complexes with amino acids, hydroxy acids, and polycarboxylic acids. Often, these precipitates occur as a gel or colloidal material that may be incorporated in a more crystalline material, such as consolidated sediments.9
Thus, physicochemical processes as well as biological processes, often acting together, give rise to calcium carbonate precipitation within sedimentary rocks. There is sufficient organic material in the sedimentary rocks between the surface and the Morrow to mediate these types of interactions.
Abundant carbonate cement in the section above the Morrow reservoir in Sorrento field may be related to the last two alteration processes. Though minor pyrite was observed in some of the cores at Sorrento the large quantities required to develop a conductivity anomaly are not present.7
The presence of conductive(less resistive) layers possibly relates to local changes in polarization of ionic organic and inorganic matter and changes in capacitance in the presence of a strong applied electrical current as is the case for deep sensing resistivity surveys. Additionally, the presence of shale, in the upper stratigraphic section, could be responsible for the decreasing resistivity related to clay alteration due to hydrocarbon seepage and changes in the associated cation exchange capacity.
Near-surface soil salinity
Salinity is a soil property referring to the amount of soluble salt in the soil. It is generally a problem of arid and semiarid regions. Electrical conductivity (EC) is the most common measure of soil salinity and is indicative of the ability of an aqueous solution to carry an electric current.
Biological processes create organic salts in the rhizosphere of plants which also add to the soil salinity. These salts may range from single dissociated positive and negative ions to large polyatomic ions.
Apparent conductivity values are seldom diagnostic in themselves, but spatial patterns and the relative magnitudes of apparent conductivity do provide information as to differences in soils and soil properties and inferential clues revealing associated hydrocarbon seepage alteration. With the influx of light hydrocarbon gases, biological processes are often enhanced yielding a large array of alteration signatures in near surface soils.1 2
At Sorrento field, 647 surface soil samples were collected and analyzed for soil salinity as electrical conductivity.3 6 The soil samples were put into solution, agitated, with the aqueous portion being analyzed using a bench top conductivity probe.
What is significant about the conductivity data is that they reflect features present at the reservoir level at the surface. For instance, the north to south trending sealing fault detected by the LOTEM survey appears as a linear trend of high conductivity values. The fault itself is not apparent at the surface or in the intervening stratigraphic zones. The fault is possibly a zone of stratigraphic weakness producing a narrow network of vertical microfractures providing a seepage pathway for hydrocarbons from the reservoir to the surface.
A second aspect of the conductivity data is that they yield a geochemical halo encircling a significant seismic porosity anomaly in the Morrow sandstone.3 The anomaly covers 480 acres in Sec. 4 of the oil field, lies to the west of the sealing fault, and is bisected by the LOTEM resistivity anomaly (Fig. 2).
Electromagnetic induction
Electrical conductivity can also be measured by electromagnetic induction using instruments that operate under principles similar to the LOTEM method and well log resistivity measurements.
Electromagnetic Induction is a low cost and rapid surveying method for measuring and assessing in situ soil conductivity. The method uses electromagnetic energy to measure and map spatial and temporal variations in the apparent conductivity of soils.
The depths of observation and measured response are influenced by the instruments coil orientation (vertical or horizontal), coil separation, and frequency, as well as the conductivity of the profiled materials; in this case soil. In the horizontal dipole orientation, the instrument is more sensitive to near surface materials. In the vertical dipole orientation, the instrument is more sensitive to deeper materials.
The transmitting coil induces a magnetic field that varies in strength with soil depth. The magnetic field is strongest about 15 in. below the soil surface and has an effective sensing depth of 5 ft (1.5 m). A receiving coil reads the primary and secondary induced currents with the relationship between the two representing soil conductivity.10
Central Kansas uplift analog
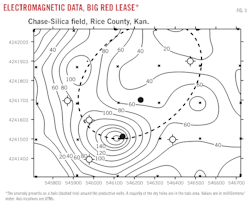
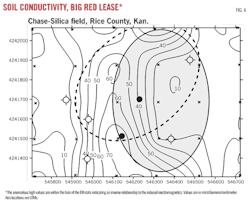
The Big Red lease in Chase-Silica field, Rice County, Kan., provides an analog using surface electrical conductivity by electromagnetic induction and laboratory analysis of soil conductivity.
Hydrocarbon production is from Cambrian age Arbuckle dolomites on the Central Kansas uplift at an average depth of 3,600 ft.
The example will focus on 30 samples around the Big Red-3 and Big Red-4 wells.1 The instrument used for the survey presented is the Geonics EM-38 conductivity meter which operates at a set frequency of 14,600 Hz. The intercoil spacing is 1 m. It has effective observation depths of 0.75 and 1.5 m in the horizontal and vertical dipole orientations, respectively. Output is calibrated to read apparent conductivity in milliSiemens/meter. The benchtop soil conductivity data are given in microSiemens/centimeter.
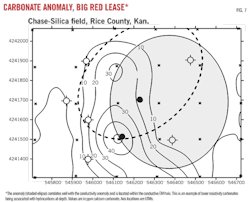
The vertical dipole EM data, when contoured, yield a halo pattern around the productive wells while the dry holes tend to be located within the halo. The conductivity of the soil samples exhibits somewhat of an apical anomaly and lies within the confines of the EM halo. A significant carbonate anomaly closely correlates with the soil conductivity and also lies within the EM halo.
As can be deduced by the anomaly size and location of producing wells to dry holes, the reservoir is limited in spatial extent and the EM and soil conductivity spatial patterns seem inverted. This may be explained by the differences in the physicochemical reactions of bulk dry soil conditions under an applied electrical current measured with the EM instrument and the water-saturated clay fraction measured at the benchtop.
The carbonate anomaly is dependent on the alkalinity source, which could be bicarbonate, carbonate, or hydroxide, as well as a variety of available organic and inorganic ions.
Tracking vertical seepage
Seepage of hydrocarbons from the reservoir to the surface, the processes involved, and the surface anomalies that result have been demonstrated and discussed.
Using various methods of electromagnetic induction for detecting resistivity and conductivity, seepage anomalies were detected throughout the stratigraphic sequence over an oil field.
Seepage evidence includes:
• A resistivity anomaly detected by a LOTEM survey over the Sorrento oil field analog. Data from the seven layer model, that exhibited both conductivity and resistivity anomalies, was mathematically processed and shown to have less noise over the better producing reservoir relative to the poorer producing reservoir. A pronounced resistivity change at the center of the traverse represents a sealing fault detected seismically at the reservoir level.
• Resistivity of producing wells vs. dry holes was low to moderate in the better producing part of the analog field. Well log resistivity in the poorer producing areas exhibited more noise with inconsistent off and on anomalies. The inconsistencies may be related to proximity to faults or changes in porosity by geochemical alteration.
• The low noise anomalies interpreted from the log resistivity are coincident with the low noise anomalies of the LOTEM survey. Areas of resistivity, independent of the method being used, appear to yield a low noise signals in areas not associated with large faults.
• Soil electrical conductivity exhibited a significant geochemical halo associated with a seismic porosity anomaly from the hydrocarbon reservoir. The highest values are coincident with a sealing fault detected seismically at the reservoir level. The geochemical halo also encloses the high resistivity area detected by the LOTEM survey.
• Microfracturing is evident due to the detection of reservoir level features at the surface by alteration phenomena.
• The application of electromagnetic induction surveys and conductivity measurements can aid in the exploration for hydrocarbons. The anomalies detected at the surface can be directly linked to hydrocarbon seepage from the reservoir.
Acknowledgments
Thank you to Esther Fueg for writing such a detailed document, which provided a wealth of data. Access to leases and geophysical data for Big Red field is courtesy of Gilbert and Stewart Operating LLC.
References
1. Fausnaugh, J.M., "Nongas-phase hydrocarbon sampling aids detection of seepage anomalies," OGJ, Jan. 5, 2009, pp. 31-36.
2. Fausnaugh, J.M., "Method is alternative to soil gas for detecting seepage anomalies," OGJ, May 19, 2008, pp. 37-42.
3. RCP, Reservoir Characterization Project Phase V, Colorado School of Mines, Sponsors Meeting Report, Oct. 3-4, 1994.
4. Schumacher, Dietmar, "Hydrocarbon induced alteration of soils and sediments," in "Hydrocarbon Migration and Its Near Surface Expression," Schumacher, D., and Abrams, M.A., eds., AAPG Memoir 66, 1996, pp. 71-89.
5. Fueg, E.M., "Can surface electromagnetic measurements delineate hydrocarbon alteration or source rock location? An investigation at Sorrento Field, Cheyenne County, Southeast Colorado," masters thesis T-4864, Colorado School of Mines, 1996, 123 pp.
6. Fausnaugh, J.M., "Reservoir Characterization Using Surface Geochemistry, Sorrento Field, Cheyenne County, Colo.," abs., AAPG Bull., Vol. 80, No. 6, p. 969, June 1996.
7. Mark, S.M., "Characterizing compartmentalization of a petroleum reservoir by integrating sequence stratigraphy, 3-D seismic interpretation, and production data, Sorrento Field, Colorado, USA," PhD thesis T-4833, Colorado School of Mines, 1995, 200 pp.
8. Jordan, J.M., and Tasci, M.T., "U.S. Patent Number 5,563,513: Electromagnetic imaging device and method for delineating anomalous resistivity patterns associated with oil and gas traps," Oct. 8, 1996.
9. Leenheer, J.A., and Reddy, M.M., "Co-precipitation of dissolved organic matter by calcium carbonate in Pyramid Lake, Nevada," Annals of Environmental Science, Vol. 2, 2008, pp. 11-25.
10. Davis, G.J., Kitchen, N.R., Sudduth, K.A., and Drummond, S.T., "Using electromagnetic induction to characterize soils," Better Crops with Plant Food, published by The Potash & Phosphate Institute, 1997, No. 4.
Bibliography
Fausnaugh, J.M., "The effect of high soil conductivity on headspace gas sampling techniques," APGE Bull., Vol. 5, No. 1, 1989, pp. 96-115.
Price, L.C., "A critical overview and proposed working model of surface geochemical exploration," in "Unconventional methods in exploration for petroleum and natural gas, symposium IV," Davidson, M.J., ed., Southern Methodist University Press, 1986, pp. 245-304.
The author
More Oil & Gas Journal Current Issue Articles
More Oil & Gas Journal Archives Issue Articles
View Oil and Gas Articles on PennEnergy.com
