Rafael Sandrea
IPC Petroleum Consultants Inc.
Broken Arrow, Okla.
The market for West Texas Intermediate crude has been flirting with $100/bbl since February and the futures market is at $109 for June and July deliveries. When crude oil prices go up it puts a burden on everyone, everything that's delivered on a truck goes up—food, beer, and steel to name a few.
Transportation (land, water, and air) consumes more than two thirds of the oil produced, and heating and industry account for the rest.
World oil demand peaking
Following a recessional drop of 2 million b/d in 2009, the fourth quarter of 2010 saw the greatest spike in world demand since 2004 with a jump of 1.4 million b/d from the 2010 first quarter, subsequently reaching record highs.
All economic indicators show that the recession is behind us and the world economy is expected to grow at a strong 4.4% interannual rate through 2015.
Most oracles (ExxonMobil, Total, OPEC, the US Energy Information Administration, and the International Energy Agency, in that order) point towards a demand of 100-105 million b/d by 2030, up roughly 20% from the 2010 level of 87 million b/d. This increase symbolizes a growth rate of 650,000-900,000 b/d/year over the next 20 years.
Can global oil supply keep up with this vigorous demand? Imbalances in supply and demand critically shape the behavior of oil prices.
The oil supply picture
Oil supply is a mix of four ingredients:
• Crude oil and condensate produced at the wellhead from 40,000+ oil fields in 90 countries.
• NGL or natural gas liquids extracted from the gas produced mainly from gas fields and from some of the gas produced with the oil; roughly half of all the gas produced around the world is processed in plants in 50 countries.
• Refinery gains or volume increases obtained from the molecular breakdown of heavy oils.
• Biofuels, the emerging fuels obtained from processing corn and sugarcane.
There are also small quantities of 'other liquids' from nonhydrocarbons and coal derivatives.
Crude oil is the mainstay of supply, accounting for 85% of the total mix. It is also the only source of spare or backup capacity for any supply disruptions!
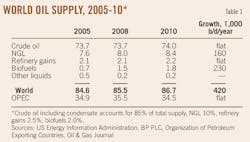
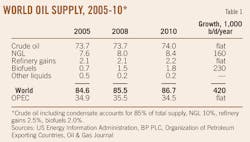
The oil supply scenario over the last 5 years (Table 1) underscores several factual trends: a) a total oil supply growth rate of 420,000 b/d/year, all on the back of NGL and biofuels, in stark contrast to the expected demand growth rate of 650,000-900,000 b/d/year, b) crude oil supply is at a plateau, c) NGL and biofuels are the only ingredients showing growth, totaling 160,000-230,000 b/d/year, respectively.
The NGL 5-year growth rate of 160,000 b/d/year is slightly less than its long term (10-year and 15-year) trend.
IEA's outlook through 2030 doubles this long term growth rate with the bulk coming from the OPEC countries. OPEC's NGL growth rate has been a soft 80,000 b/d/year the last 5 years.
Biofuels is the 'new' fuel. Its growth rate was just 36,000 b/d/year before 2005. Following an initial jump attributable to government directives and support, the growth rate subsequently decreased to 150,000 b/d/year in the last 2 years. This is attributable to unintended concerns such as land use changes, competition with food supply and fresh water resources, etc., making prognosis of future growth somewhat tenuous.
BP's 2011 outlook uses a growth rate of 250,000 b/d/year through 2030, similar to the present 5-year average, and coming mostly from the US and Brazil.
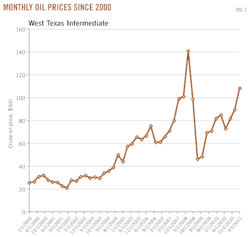
Coincidently, the timeline covering the past 5 years provides a unique insight into supply-demand trends before, during, and after a giant recession. For the first time in more than 100 years we have seen a continuous climb in oil prices over a prolonged period (2004-08) driven mostly by market forces (Fig. 1).
Previous price increases—there were three since the 1970s—were characterized by jumps mostly driven by geopolitical events (embargoes, revolutions, and wars). In this same vein, the run-up in prices through mid-2008 provides a benchmark for crude oil supply at its maximum capacity—all producing countries were doing their utmost to take advantage of an unprecedented price bonanza.
Is the 5-year oil supply growth rate of 420,000 b/d/year representative of the future trend? The comparable 10-year (2000-10) growth rate is 890,000 b/d/year, but this dropped sharply to 420,000 b/d in the last 5 years following a zero growth rate of crude, the primary component of oil supply.
Crude oil output was at an all time high of 63 million b/d when the 1980 recession began and dropped a huge 10 million b/d by 1982 as world demand shrank. Recovery was slow, and it took 15 years for crude output to return to 63 million b/d, thereafter rising to 68 million b/d in 2000 and to 73.7 million b/d in 2005. From then on it has remained flat all through the sharp run-up in prices to 2008 and to the present day.
Output has increased just 10 million b/d over 30 years in spite of 400+ billion bbl of new oil discoveries during the same period. The culprit of this nonlinear behavior is field decline dynamics, which unfortunately are not well understood by analysts.
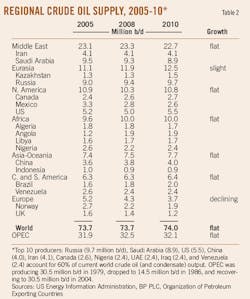
It is important to note that the plateau trend of crude oil over the past 5 years also extends to all oil producing regions with the exception of Europe, which is in decline (Table 2). This would certainly indicate a worldwide state of limited if any spare capacity.
Previous studies1 show that this trend was predictable and that it may be sustained through 2015 with global production entering a slow decline thereafter. Crude oil production capacity is expected to return to 63 million b/d by 2030, a negative rate of 500,000 b/d/year.
OPEC's supply pattern essentially mirrors the global print (Tables 1 and 2). At the start of the 1980 recession, OPEC was producing 30 million b/d of crude, then an all-time high, falling to a low of 14 million b/d by 1986 and finally returning to the previous high 25 years later.
In concert with rising oil prices since 2004, OPEC's output reached a new high of 32 million b/d in 2008, so overall the organization has been able to generate a net increase of merely 2 million b/d over 30 years. As a result, OPEC's contribution to the expansion of global crude supply during this 30-year span was just 20%.
Closing remarks
Consequently, any growth in supply to satisfy an increasing oil demand would have to come from NGL and biofuels as has been the case in the last 5 years.
A significant contraction in demand from the transportation sector is almost mandatory in the short term. The irony is that high gas prices at the pump essentially act as a 'direct' tax on consumption.
Fortunately, vast reserves of natural gas that have been discovered in the US in the past 5 years can now become an important source of transportation fuel in the form of compressed natural gas (CNG). This would further open opportunities for other fuel concepts such as hydrogen/natural gas blends or HCNG, which have already been tested by the US DOE, and eventually for fuel cell vehicles.
Natural gas prices are currently one-fifth those of oil on an energy equivalent basis!
Reference
1. Sandrea, R., "Oil, gas supply trends point to tight spots, higher prices," OGJ, Nov. 23, 2009, p. 37.
The author
More Oil & Gas Journal Current Issue Articles
More Oil & Gas Journal Archives Issue Articles
View Oil and Gas Articles on PennEnergy.com


