Fengmei Song
John McFarland
Barron Bichon
Southwest Research Institute
San Antonio
Luc Huyse
Chevron USA Inc.
Houston
Fraser King
Integrity Corrosion Consulting Ltd.
Nanaimo, BC
Laurie Perry
Southern California Gas Co.
Los Angeles
Mark Piazza
Pipeline Research Council International
Falls Church, Va.
By first defining the term "extremely unlikely internal corrosion threat" as 20% wall loss within 50 years, researchers developed a probabilistic model that predicts whether an IC threat, under a nominal operating condition, is extremely unlikely.
The first article of this series (OGJ, Jan. 3, 2011, p. 116) showed water saturation limit (SL) computed from the IGT-8/ASTM D1142 method with the use of actual field temperature and pressure as following a normal distribution. It then developed a simple relation allowing for determination of the SL's standard deviation from temperature mean and amplitude. This simple relation and the threshold limits (TLs) of water and CO2 served as inputs in the model computations.
The conclusion, presented here, details the probabilistic model and computational results.
Probabilistic model
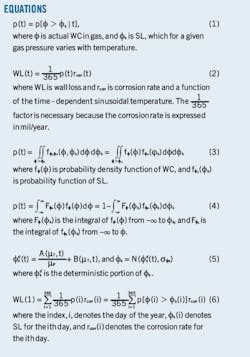
Equation 1 expresses the wetness probability of gas in a pipeline. As long as the variation of φs with temperature (sinusoidal) and the uncertainty (or distribution) of its residuals can be determined, the wetness probability is fully defined.
Equation 2 can determine daily wall loss.
For this work, the fluctuation of corrosion rate, due to fluctuation of temperature and pressure, is neglected as a first approximation. The accumulated yearly wall loss is the summation of Equation 2 for all 365 days of the year.
Equation 3 can determine the probability of wetness in Equation 2.
Integrating Equation 3 yields Equation 4.
Equation 5 yields the expression of SL.
Equation 6 defines yearly wall loss, denoted by WL(1). Note that φ(i), φs(i) and rcorr(i) are all random variables; φs(i) and rcorr(i) are indexed by i because their probability distributions are functions of i, which represents the day of the year.
Equation 7 calculates total wall loss in "n" years.
Two cases examine the two different functions of water content (WC) to be used.
• Upper bound constant WC. For a given constant upper bound WC, such as the TL of 7 lb/MMscf, the IC threat, thus determined, is conservative. Equation 8 provides the probability of wetness in this condition.
Equation 9 can determine the yearly wall loss, WL(1), with the total wall loss in "n" years calculated by Equation 7.
• WC follows the upper bound lognormal distribution. Since SL follows a normal distribution, when WC distribution is time independent, it becomes Equation 10.
Part 1 of this series showed the probability density function of WC to be a lognormal distribution in the form described by Equations 11-13.
The inverse conversion of the mean and variance yields the mean and variance of the underlying normal distribution shown in Equations 14-15.
Equation 16 provides the explicit expression of Equation 10.
Equation 17 defines yearly wall loss, WL(1), and the total wall loss in "n" years can be calculated by Equation 7.
• Corrosion rate expression. With IC mainly caused by CO2 contained in natural gas, a number of equations exist to express the dependence of corrosion rate vs. temperature and CO2 partial pressure. This work used the de Waard-Lotz equation (Equation 18). Although recognized as conservative, this equation is still the most widely used in the pipeline industry due to its ease of use.
• Method for solving model equations. To satisfy the definition of "extremely unlikely IC threat," or the allowable wall loss of 20% within 50 years, Equation 7 must satisfy Equation 19.
For a particular wall thickness (WT), the calculated WL(1) from Equation 19 can be compared to Equation 9 or 17 to determine if the IC threat in a given condition is extremely unlikely.
Conversely, with the maximum allowable wall loss being 20% WT, Equations 7 and 9 or 17 can be used to determine the maximum number of years for which the IC threat can be described as extremely unlikely.
If the criterion of 20% wall loss within 50 years is met and the WC can be assumed to be constant with time, the upper bound WC can be determined by comparing Equations 7 and 9 or 17 and using an iteration method.
Conservative probability
Using a conservative deterministic corrosion rate allows narrowing the definition for the condition of extremely unlikely IC threat. With a relatively thin wall (0.20 in.) and an acknowledged conservative corrosion rate (40 mil/year), Equation 20 can determine the maximum fraction of time a pipe surface can be allowed to be wet.
The definition of "an extremely unlikely IC threat" may be stated as: for a pipe with a relatively thin wall (0.2 in.) at a conservative constant corrosion rate (40 mil/year), a wall loss of no more than 20% WT can be allowed within a time span of 50 years.
Equation 20 provides a maximum fraction of time or a ceiling probability that water can be present at the pipe surface while corrosion remains extremely unlikely. The time of water presence can be the total duration of water condensation, liquid intrusion from upsets, leftover hydrotest water, and evaporation. This article considered only water condensation.
Under this conservative definition, the probability of an IC threat can depend on parameters including WT, corrosion rate, and expected life of a pipeline within a given wall loss. Conservatism in each parameter achieves the 2% wetness probability. Several companies have accepted this definition and thus it is used in this work to set up the probability limit for calculating maximum allowable water presence in gas.
The subjective nature of the pipe WT and corrosion rate in this definition example makes a broader definition preferable for modeling purposes, such as wall loss <20% WT within 50 years. This definition provides freedom for operators to use real pipe WT and a corrosion rate more appropriate than 40 mil/year for the condition of a specific pipeline.
This broader definition is incorporated in an Excel tool allowing operators freedom to use the de Waard-Lotz equation1 to determine corrosion rate, incorporating the effects of temperature and CO2 content in gas. Discussion of this Excel tool, however, lies beyond the scope of this article.
For 1 year (n = 1) the summation of the probability of wetness in any given day multiplied by the time in a day (Equation 21) can approximate the total time the pipe is wet.
The overall probability of wetness (or yearly average wetness probability) is the wet time divided by total time. Equation 22 represents this for a total period of 1 year, or 365 days.
For a fixed upper bound WC, Equation 22 allows creating a series of contours of probability. Conversely, given the maximum allowable probability of wetness at 2%, an inverse calculation of Equation 22 can determine the contours of WC.
Computational results
Comprehensive modeling was performed for this work, but it is impractical to present all key results here. Selected charts instead show the usefulness of the model.
Fig. 1 shows contours of the probability of wetness, or the time-percent a pipe is wet for a wide range of temperature mean and amplitude and for pressure 800 psi. The values on each curve are in percent, e.g., the value of 2 on the curve refers to 2%. Equation 22 developed this chart with the use of sinusoidal temperature, a fixed average pressure, and a conservative constant WC at 7 lb/MMscf.
For a given probability of wetness, such as 2%, the contour curve separates the chart into two regions, more clearly shown in Fig. 2a. The region below and to the right of the curve represents operating conditions under which an IC threat is extremely unlikely, while the region above and to the left of the curve represents conditions where an IC threat is not extremely unlikely, although may still be unlikely. The extremely unlikely IC threat is defined as wall loss not reaching 20% wall thickness within 50 years.
In Fig. 1 the average pressure for a period of at least 1 year represents the operating pressure. Plotting the daily temperature vs. time for at least 1 year yields the seasonable amplitude. Since TL is the upper bound of WC in gas, assuming it to be the real WC in gas ensures that the determined probability of wetness in the chart is conservative. Or, the wetness probability in the chart is greater than predicted if the real WC is used.
For a given operating pressure, Fig. 1 shows intuitively that the lower the average temperature and the higher the temperature amplitude (or seasonal fluctuation of temperature) the greater the probability of wetness. Under usual operating circumstances the mean operating temperature is greater than 45° F. and the amplitude is less than 8° F. The IC threat is extremely unlikely, because the probability of wetness does not exceed 2%. For the 28 lines whose field temperature and pressure data were analyzed, the minimum average temperature is 39.4° F. and the mean average temperature 70.2° F.; the average amplitude is 10.8° F. and the maximum amplitude 21.7° F. The maximum average pressure measures 1,160 psi.
For Fig. 1, moving from the lower-right corner, where the probability of wetness is smallest, to the upper-left corner, where the probability of wetness is greatest, the probability of wetness appears to increase progressively more rapidly. For each curve, a sharp turn of the contour curvature occurs across the broken red line. The artificial conservative setting of 0.5 lb/MMscf for the standard deviation of SL residual to avoid it going negative (Equation 9 in the first article of this series, OGJ, Jan. 3, 2011, p. 116) produces this sharp turn. Using 0.5 lb/MMscf causes prediction of the wetness probability on the left to the turning point of the curvature to be lower than if the standard deviation were to continue decreasing from 0.5 lb/MMscf, showing use of 0.5 lb/MMscf leads to a more conservative prediction of wetness probability.
The operating temperature's sinusoidal relation with time causes the SL also to follow a sinusoidal relation with time. The probability of water condensation only becomes relevant near the bottom of the sinusoidal temperature curve because there the SL is lowest.
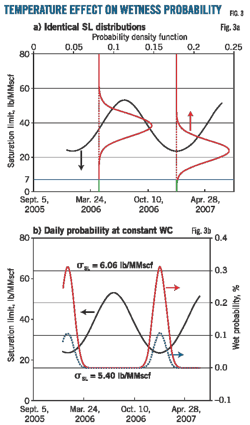
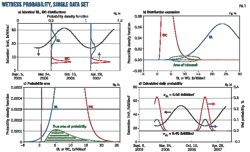
Fig. 3a shows an SL curve superimposed by the normal distribution of the SL residual determined from the corresponding field data (σSL = 6.06 lb/MMscf). The probability of water condensation consists of the tiny green area under the SL = 7 lb/MMscf blue line. Fig. 3b shows the calculated numerical daily probability of wetness, in which the red curve uses the standard deviation determined from the actual field data, while the blue curve uses the standard deviation resulting from prediction (σSL = 5.40 lb/MMscf).
The increase of SL due to rising temperature, reflected in Figs. 3a and b, causes the corresponding green area or the probability of water condensation to decrease exponentially because of the error function followed by the normal distribution of SL (Equation 5). The wetness probability is high at the valley of SL where the temperature is lowest. Fig. 3a should have exactly the same probability density functions of SL residuals superimposed across each point of the SL curve. The two SL distribution curves shown are examples.
For this particular example with a total pressure of 824.6 psi, mean temperature of 77.2° F. and amplitude of 13.2° F., the overall (or average) yearly wetness probability measures about 0.058% for σSL = 6.06 lb/MMscf based on actual field data or 0.018% for the calculated value of σSL = 5.40 lb/MMscf. The corresponding accumulated time over 50 years the pipe is wet (or the total time of corrosion) equals 0.029 years for σSL = 6.06 lb/MMscf and 0.009 years for σSL = 5.40 lb/MMscf. The corresponding total wall loss for a 0.2 in. thick pipe wall at a corrosion rate of 40 mil/year is: 0.029 × 40 × 0.0254/5 = 0.58% WT for σSL = 6.06 lb/MMscf or 0.18% WT for σSL = 5.40 lb/MMscf. Since both wall-loss predictions are much smaller than 20% WT, the condition of an IC threat is extremely unlikely. The wetness probability of 0.018% calculated with σSL = 5.40 lb/MMscf is consistent with the operating chart in Fig. 1.
Fig. 2b results from superimposing the freezing borderline and the field data of the 28 lines used to develop the probabilistic model to Fig. 2a. The region above and left of this freezing borderline represents conditions that allow the formation of ice, conditions operators try to avoid. No data from the 28 lines fall in this freezing zone. Completely avoiding this freezing condition reduces the operating conditions under which an IC threat would not be extremely unlikely to the region between the freezing borderline and the 2% wetness probability line. Just two data points from the 28 lines fall within this region.
Since the robustness of the developed model depends on the amount of field data and the upper-left corner is of most concern because water condensation has a higher probability of occurring there, more field data from this region would be particularly valuable.
Fig. 2c shows the contour curves for the four pressures with the fixed 2% probability of wetness. The region where an IC threat is extremely unlikely decreases as total pressure increases, and for the same increment of pressure, 200 psi in this case, the decrease in the region of an IC threat being extremely unlikely is smaller at higher pressures, reflected by a smaller space between the two adjacent curves.
Fig. 2c also plots a set of field data whose operating pressure and mean temperature were not given. Assuming mean temperatures to be the average of the minimum and maximum temperatures provided makes it clear that with a normal operating pressure of less than 1,200 psi, operating this line is safe as the field data lie to the far lower right of the 1,200-psi contour line. Fig. 2c serves as a practical operating chart to determine if an IC threat under a nominal operating condition is extremely unlikely.
Using Fig. 2c requires data for the average total pressure, yearly nominal temperature mean, and seasonal amplitude. Given the latter two values, a point can be found in the chart such as the pink diamond shown with temperature mean of 66° F. and amplitude of 17° F. At this point the estimated pressure is about 940 psi, the greatest average pressure allowed in the pipeline while still maintaining an extremely unlikely IC threat. If this pressure (940 psi) is greater than the actual average operating pressure, such as 900 psi, the IC threat operating under this condition is extremely unlikely. Conversely, if this determined pressure from the chart is equal to or smaller than the actual average operating pressure (such as 1,000 psi), the IC threat is not extremely unlikely.
Fig. 4 shows the maximum allowable WC contours at a given pressure, the inverse computational results of Fig. 1. The 2% probability curves in Fig. 1 are identical to the curves of 7 lb/MMscf in Fig. 4. Using the operating chart of Fig. 4 requires the operator provide the nominal mean and amplitude of temperature and the average operating pressure to determine through interpolation the maximum allowable WC to ensure an extremely unlikely IC threat.
The significance of Fig. 4 compared with Fig. 2c is its variable WCs, rather than contours of variable maximum allowable pressure. Fig. 4 shows that for a given operating pressure, with increasing temperature mean and decreasing temperature amplitude (conditions moving from the upper-left corner toward the lower-right corner), the maximum allowable WC increases. In the portion of the operating chart comprising the lower-right region to the 7 lb/MMscf curve, the maximum allowable WC is greater than 7 lb/MMscf, showing the IC threat with the use of 7 lb/MMscf as TL in this region as extremely unlikely.
Conservative lognormal
The conservative lognormal distribution of WC, with a mean of 3.87 lb/MMscf and standard deviation of 1.80 lb/MMscf, determine the wetness probability contours. Fig. 5 shows the results for 800 psi. The contours are smooth curves, different from the deflecting contours shown in Fig. 1 for the constant WC of 7 lb/MMscf. Equation 23 determines the standard deviation of SL and the first order derivative of Equation 23 is discontinuous at the standard deviation of 0.5 lb/MMscf, producing the points of defection on the contour curves in Fig. 1.
For the conservative lognormal distribution, the WC at 95% confidence level equals 7.27 lb/MMscf. At WCs of 5 and 7 lb/MMscf, the confidence levels are 78.8% and 94.1%, respectively. This result suggests that using the lognormal distribution of WC to determine an IC threat is, in general, less conservative than using a constant WC of 5 or 7 lb/MMscf. For that reason, compared to Fig. 1, the contours in Fig. 5 shift toward the upper left, generally expanding the zone of the extremely unlikely IC threat.
Fig. 6a shows a comparison of the 2% wetness probability contours at 800 psi for the three cases described in the preceding paragraph. At this pressure and in the range of temperature mean and amplitude shown in the chart, the contour line with the WC of lognormal distribution lies completely on the upper-left side of the contour with constant WC of 7 lb/MMscf, showing that at 800 psi the region of an extremely unlikely IC threat predicted by the WC of lognormal distribution is in all instances less conservative than the prediction from using the constant WC of 7 lb/MMscf.
There is, however, a small region predicted by the use of WC of lognormal distribution more conservative than the prediction with the use of a constant WC of 5 lb/MMscf, the triangle surrounded by the two contour curves and the left vertical axis.
Similar to Fig. 2c, Fig. 6b shows the contours of the 2% wetness probability at different pressures, but with the maximum allowable pressure predicted by the conservative lognormal distribution of WC. The use of this chart is similar to Fig. 2c. Determining whether an IC threat under an operating condition is extremely unlikely requires the user to provide yearly average operating pressure, yearly temperature mean, and seasonal amplitude. If the pressure determined from the chart is greater than the actual operating pressure, the predicted IC threat is extremely unlikely. Otherwise the IC threat is not extremely unlikely.
Distributions of WC make determination of daily wetness probability more complex. Fig. 7a shows distributions of SL in blue and WC in red, superimposed to the daily SL curve (black). Although the SL standard deviation is fixed at 6.06 lb/MMscf, the daily SL mean varies with time, following the SL vs. time curve or at the cross point of the vertical black dashed line and the solid black curve. This superimposition of SL is exactly the same as in Fig. 3a, but in Fig. 7a the scale of the top axis in pink is reduced to show the full WC distribution more clearly. Neither the mean nor standard deviation of WC varies with time in Fig. 7a.
Fig. 7b loosely treats wetness probability in the intersecting area of the two probability density function curves of the SL and WC and the dashed horizontal line. Fig. 7c scales-up Fig. 7b vertically to show the true area of wetness probability.
Equation 10 calculates daily wetness probability. Using the SL standard deviation determined from the actual daily temperature and pressure (standard deviation = 6.06 lb/MMscf) yields the red curve in Fig. 7d, while the broken blue curve is predicted by using the SL standard deviation from Equation 23 (standard deviation = 5.40 lb/MMscf).
Compared with Fig. 3b, Fig. 7d shows a smaller daily wetness probability, as expected, further suggesting the wetness probability predicted with the lognormal distribution of WC as less conservative than with use of the constant WC of 7 lb/MMscf. Integrating daily wetness probability for a year and dividing by the number of days in a year yields the accumulated wetness probability for a year. Extrapolating this yearly probability for 50 years (assuming the same operating condition) allows determining the total time the pipe is wet by multiplying by 50. Applying the corrosion rate can determine accumulated wall loss over 50 years.
Fig. 7 uses a yearly wetness probability of about 0.0203% (σSL = 6.06 lb/MMscf) or 0.00739% (σSL = 5.40 lb/MMscf). For 50 years, the accumulated time of corrosion is 0.01015 year or 0.0037 year, respectively. Total wall loss for a 0.2-in. thick pipe wall at a corrosion rate of 40 mil/year equals: 0.01015 × 40 × 0.0254/(0.2 × 25.4) = 0.206% WT for σSL = 6.06 lb/MMscf or 0.075% WT for σSL = 5.40 lb/MMscf. Both wall losses are much smaller than 20% WT, and thus the IC threat in this operating condition is extremely unlikely. The calculated yearly wetness probability of 0.00739% for σSL = 5.40 lb/MMscf is consistent with the operating charts shown in Fig. 5.
Acknowledgment
This work was sponsored by PRCI.
Reference
1. De waard, C., and Lotz, U., "Prediction of CO2 corrosion of carbon steel," NACE Corrosion 1993, New Orleans, Mar. 16-21, 1993.
More Oil & Gas Journal Current Issue Articles
More Oil & Gas Journal Archives Issue Articles
View Oil and Gas Articles on PennEnergy.com
