Practical equations calculate gas flow rates through venturi valves
Oil field operators can use several practical equations for calculating flow rates of natural gas through venturi gas-lift valves.
For critical flow, this analysis derived such equations from a rigorous theoretical model for gas isentropic evolution that uses real-gas calculations not restricted to density but encompassing also other relevant thermodynamic properties.
This rigorous model is complex and requires a computational algorithm and relatively much computer time.
For expeditious hand calculations or using simple spreadsheets, the equations presented in this article are within the accuracy needed and require much less computational effort.
For subcritical flow, this article suggests an approximate approach because venturi gas-lift valves should always be operated in critical flow.
Operators are installing more venturi nozzle, or simply venturi, gas-lift valves in continuous gas-lift wells worldwide. Various articles1-4 describe field applications and the resulting benefits.
In Brazil, about 200 wells, mostly offshore, now have these valves.
Dynamic performance
The dynamic performance of a venturi valve is well-known.1 2 One may define dynamic performance of a gas-lift valve as the behavior of gas flow through the valve as a function of the parameters involved, namely, pressure upstream and downstream, temperature upstream, gas composition, and characteristics of the valve, such as internal geometry, material, and surface finishing.
In experimental terms, a reference is used to obtain flow rate curves for each valve as a function of the downstream pressure while maintaining the upstream pressure (and temperature) constant.
The figure compares experimental dynamic performance of a venturi valve with that of a conventional square-edged orifice valve. The most important difference relates to critical flow, the region of the curve where the gas flow rate through the valve is constant, irrespective of downstream pressure.
This happens when downstream pressure is less than a certain fraction of the upstream pressure. This fraction is about 0.5 for an orifice valve and 0.9 for a venturi valve.
Thus, in view of the usual pressure differentials between casing (injection pressure) and tubing (production pressure), orifice valves operate in subcritical flow and venturi valves in critical flow.
References 2 and 5 contain an explanation of such performance difference and other aspects related to venturi valve behavior.
Thornhill-Craver equation
The traditional approach in gas-lift literature for modeling valve dynamic performance uses the Thornhill-Craver equation.6 The equation is for compressible, one-dimensional, and isentropic flow of a perfect gas through a restriction, with the addition of a correction factor (discharge coefficient) to account for deviations encountered in real cases.
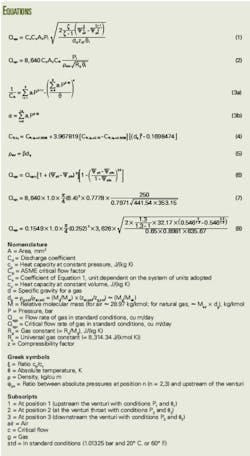
To partially correct the equation due to real-gas behavior, the compressibility factor is generally shown in the classical form of that equation, which then becomes Equation 1 in the equation box.
Cs is a factor that depends on the units used and on the reference conditions for volumes, for example, standard conditions.
Using English units (pressures in psia, flow rates in MMscfd, areas in sq in., temperatures in °R, and standard conditions of 60° F. and 14.70 psia), it has a value of 0.1549.
In this case, it is necessary to include the factor 32.17 (lbm-ft)/(lbf-sec2) for multiplying the numerator of Equation 1.
For the standard conditions usually adopted in Brazil (20° C. and 1.01325 bar), pressures (absolute) in bar, areas in mm2, temperatures in K, and flow rates in cu m/day, the constant Cs has a value of 423.5.
If one reduces the ratio between absolute pressures at position 2 and upstream of the venturi (Ψp2 = P2/P1) continuously, for example if the pressure at the restriction P2 is continuously decreased with a constant upstream pressure P1, the flow rate increases until Ψp2 reaches the critical ratio, Ψp2c = P2c/P1, at which the velocity at the restriction is sonic and any further reduction in Ψp2 does not change the flow rate. Thus, if Ψp2 < Ψp2c, Ψp2c replaces Ψp in Equation 1.
One can obtain the critical ratio Ψp by differentiating Equation 1 with respect to Ψp2 and equating it to zero (since Ψp is the Ψp2 ratio for which the flow rate is maximum). For example, with ζ = 1.3 (a typical value for natural gas), Ψp2c = 0.546.
The derivation of Equation 1 comes from basic thermodynamics and is not discussed in this article. Reference 5 presents the assumptions associated with this equation and the reasons why the Thornhill-Craver equation is not the most adequate model to calculate flow rates through venturi gas-lift valves.
Petrobras's gas lift installations include high-pressure applications with venturi or similar valves. Improvement in modeling key equipment such as gas-lift valves is vital for a correct design and operation of that artificial lift method under these circumstances.
This motivated the development of a rigorous model, which Reference 5 presents for nitrogen and natural gas.
Critical flow
In terms of critical flow of gas in nozzles, an important reference is the ASME/ANSI MFC-7M-1987 standard7 for measuring gas flow rate with sonic nozzles (venturi nozzles). From that standard, Equation 2 calculates the critical flow rate in cu m/day, where CR is the critical flow coefficient. The coefficient takes into account the deviation from the perfect gas behavior. For a perfect gas, CR is only a function of the heat capacities ratio ζ.
The conditions of temperature (K) and absolute pressure (bar) in Situation 1 are of stagnation (gas at rest). The equation requires area A2 in mm2, Rg in J/(kg K), and ρstd in kg/cu m.
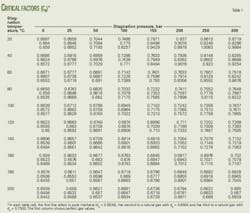
A computer application, written in Delphi, performed calculations for nitrogen and natural gas using the rigorous model discussed in Reference 5. Comprehensive comparison with literature data, both theoretical and experimental, validate the model. Table 1 gives values of CR for three natural gas specific gravities, covering practical ranges of pressure and temperature.
The model is rigorous and limited only by the precision of the DAK (Dranchuk and Abou-Kassem)8 equation of state used, and the assumptions made (particularly isentropic flow and stagnation conditions upstream of the venturi).
The equation of state is relatively simple, but, even so, the model requires a computational effort considerably greater than that of explicit models such as the classic Thornhill-Craver (Equation 1).
This somewhat restricts the model application, particularly in gas-lift simulators, which may calculate flow rate through gas-lift valves several times until reaching the convergence of the solution well flow rate.9 Thus, it is highly desirable to have an explicit approach even with (acceptable) loss in accuracy.
This article presents explicit correlations that fulfill that requirement and cover the region of interest (stagnation upstream conditions, 20-300 bar and 20-200° C, natural gas with specific gravity from 0.5538 to 0.75 with small quantities of N2, CO2, or H2S).
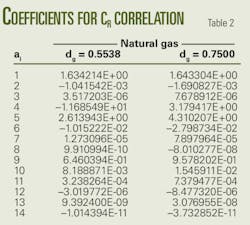
Equations 3a and 3b show the correlations developed for natural gas with specific gravity of 0.5538 or 0.7500.
For intermediate gravities dg, calculate CR for 0.5538 and 0.7500 gravities with Equations 3a and 3b and apply the interpolating equation (Equation 4).
In Equations 3a and 3b, P (absolute pressure) in bar, and θ in K, are the upstream stagnation conditions and Table 2 gives the coefficients of ai.
The comparison of CR rigorous calculation with the correlation presented, in the range of interest for P, θ, and dg, shows an absolute average deviation of 0.27% and a maximum deviation of 1.1%. One may use the correlation for specific gravities greater than 0.75 although the error increases accordingly.
As an example, for dg = 0.80, the absolute average deviation is 0.43% and the maximum is 2.6%.
In any case, the rigorous model loses accuracy as specific gravity increases beyond 0.75 due probably to limitations of the DAK equation of state to accurately describe the behavior of such gases, particularly at high pressures. In this case, the preference is to employ a compositional equation of state.
Once one obtains the CR, the next step is to calculate the critical flow rate with Equation 2. Equation 5 can obtain ρstd for natural gas as a function of specific gravity dg, based on standard conditions of atmospheric pressure and 20° C. In the equation the coefficient β in kg/cu m is 1.20761 (for a perfect gas, β is 1.20434).
For a standard temperature of 60° F., the ρstd new coefficient β for Equation 5 is 1.22637 (perfect gas β is 1.22288).
Subcritical region
The intent is to always operate a venturi valve in critical flow. Thus, the main concern is for modeling critical flow instead of subcritical flow.
Reference 5 presents a simplified model to estimate throat pressures in subcritical flow from downstream pressures. Since such an approach is more complex, the suggestion is to use the empirical Equation 6 for the subcritical region P3c/P1 = Ψp3c < Ψp3 ≤ 1.0.
Accurate modeling for the subcritical region is not required for steady-state simulations (well in normal operation) involving venturi gas-lift valves. Its relevance for transient simulations (well discharge, for example), however, is not established. Moreover, it is highly relevant for other types of valves as in the case of orifice gas-lift valves, which nearly always operate in subcritical flow.
Example calculation
To illustrate the calculations, consider a 1.5-in. OD venturi gas-lift valve with a nominal 0.25-in. throat diameter. Casing pressure and temperature are 3,626 psia and 176° F. (635.67° R.), respectively. Natural gas specific gravity is 0.65.
The requirement is to calculate the theoretical critical flow rate in MMscfd (standard temperature of 60° F.).
It is advisable to check with the manufacturers the real throat diameter that corresponds to the nominal one because some differences may occur due to fabrication. In general, such differences are very small but for venturi valves, it may represent a significant difference in flow rates.
Check dimensional tolerances as well. For a 1.5-in. OD venturi valve model manufactured in Brazil, the throat diameter is 6.40 mm (Table 3).
Annular casing-tubing areas normally are much larger than throat areas and one may assume casing conditions as the stagnation ones with negligible error.
To convert from given field units to units adopted in this article, one needs to multiply pressure in psia by 0.0689476, obtaining 250 bar as the stagnation absolute pressure. Subtracting 32 from the given temperature in °F. and dividing by 1.8, results in 80° C.
To obtain the corresponding stagnation absolute temperature, add 273.15 to yield 353.15 K.
The gas constant is Rg = 8,314.34/(0.65 × 28.97) = 441.54 J/(kg K) and, from Equation 4, ρstd is 0.7971 kg/cu m (standard temperature 60° F.).
For the rigorous model, from Table 1, CR = 0.7778. Applying Equation 2, as shown in Equation 7, one gets 171,709 cu m/day. To convert to MMscfd, multiply by 3.5315 × 10⁻⁵ to obtain 6.064 MMscfd.
As additional information, the model from Reference 5 yields critical (absolute) pressure at the throat of 126.75 bar (representing a throat critical pressure ratio of 126.75/250 = 0.507), with corresponding temperature and (sonic) velocity of 305.99 K and 403.9 m/sec, respectively.
For the correlation of CR, use Equations 3a and 3b to obtain CR = 0.754646 for dg = 0.5538 and CR = 0.815716 for dg = 0.75. Interpolate for dg = 0.65 with Equation 4 and get CR = 0.7800. Then, applying the previous Equation 7 and substituting 0.7778 with 0.7800 for CR, the calculation obtains a Qvgc = 172,195 cu m/day or 6.081 MMscfd, a 0.28% difference from the rigorous model.
For a perfect gas, from Table 1, first column, CR = 0.6590. From Equation 4, perfect gas ρstd is 0.7949 kg/cu m (standard temperature 60° F.). Then, replace these values in Equation 7, to obtain a Qvgc = 145,885 cu m/day or 5.152 MMscfd, a 15% difference.
For the Thornhill-Craver equation and from gas lift literature which says ζ = 1.3 is a typical value, the calculation give a Ψpc = 0.546. DAK equation gives zg1 = 0.8981.
The application of Equation 1 with English units, as shown in Equation 8, results in a gas flow rate of 5.504 MMscfd, a 9% difference.
Discharge coefficient
The model calculates theoretic flow rates. For real valves, the assumptions made, although accurate, are not strictly valid. Thus, there is a need to introduce a correction, in general in the form of a discharge coefficient, Cd, as shown in Equations 1 or 2.
In some cases, it is possible to derive theoretical or semitheoretical expressions for that coefficient. For gas-lift valves, however, that determination is experimental.
Petrobras is undertaking this work at its gas-lift test facility in Sergipe, Brazil and the results will be presented in the future.
Preliminary experimental curves for 1.5-in. OD venturi valves manufactured in Brazil under Petrobras license have shown discharge coefficients close to 1.0 (Table 3).
The same was found for a 1-in. OD model with a 1⁄8-in. throat. This comparison is limited but promising. ✦
References
1. Tokar, T., et al., "New Gas Lift Valve Design Stabilizes Injection Rates: Case," Paper No. SPE 36597, SPE ATCE, Denver, Oct. 6-9, 1996.
2. Faustinelli, J., et al., "A Solution to Instability Problems in Continuous Gas-Lift Wells Offshore Lake Maracaibo," Paper No. SPE 53959, SPE Latin American & Caribbean Petrloleum Engineering Conference, Caracas, Apr. 21-23, 1999.
3. Lyngholm, A., et al., "Technology Extends Gas Lift Reach," World Oil, April 2007, pp. 95-8.
4. Kartoatmodjo, G., et al., "An Integrated Approach to Field Surveillance Improves Efficiency in Gas Lift Optimization in Bokor Field, East Malaysia," IPTC 12225, Internatioanl Petroelum Technology Conference, Kuala Lumpur, Dec. 3-5, 2008.
5. Almeida, A.R., "A Model to Calculate the Theoretical Critical Flow Rate through Venturi Gas Lift Valves," SPE manuscript 126184-MS, SPE Journal. (submitted).
6. Craft, B.C., et al., Well Design: Drilling and Production, Prentice Hall, 1962, pp. 427-8.
7. Measurement of Gas Flow by Means of Critical Flow Venturi Nozzles, ASME/ANSI MFC-7M-1987, New York, May 31, 1987.
8. Dranchuk, P.M., and Abou-Kassem, J.H., "Calculation of Z Factors For Natural Gases Using Equations of State," Journal of Canadian Petroleum Technology, July-September 1975, pp. 34-36.
9. Almeida, A.R., and Slobodcicov, I., "Continuous Gas Lift Performance Analysis," World Oil, September 1998, pp. 91-6.
The author
Alcino R. Almeida ([email protected]) is a senior petroleum engineer with Petrobras R&D Center (CENPES) in Rio de Janeiro. He is involved with gas-lift optimization, including new equipment, flow modeling and software development. He joined Petrobras in 1984 and CENPES in 1988. Almeida holds a BS and an MS in mechanical engineering from Federal University of Rio de Janeiro.
More Oil & Gas Journal Current Issue Articles
More Oil & Gas Journal Archives Issue Articles
View Oil and Gas Articles on PennEnergy.com


