Dimensional metrology aids pipe manufacture, installation
Tim Clarke, Richard Gooch
Optical Metrology Services (OMS) Ltd.
Bishops Stortford, UK
Dimensional metrology allows engineers to ensure fabricators meet precise line pipe specifications. The interplay between dimensional metrology and both fit-up and automated ultrasonics technology can also improve pipeline assembly, enhance the quality of assembly, and reduce the time taken to lay a pipeline.
This article describes how measurement technology can be applied during fabrication of steel catenary risers and other fatigue sensitive pipes to ensure they meet appropriate levels of geometric performance.
Background
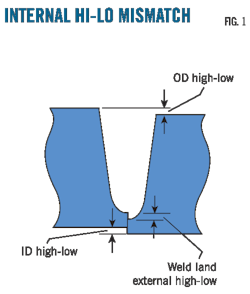
Tides, ocean storms, currents, and swell create a highly dynamic environment for the SCR, necessitating design and fabrication processes to mitigate stress and fatigue factors. Proper pipe installation requires addressing a number of highly critical aspects of pipe fabrication correctly. The internal Hi-Lo mismatch between butted pipes is one such aspect (Fig. 1).
Reducing Hi-Lo contributes to a good weld and decreases stress at the weld joint. Hi-Lo mismatch must typically measure <0.5 mm in fatigue-sensitive pipeline sections. The seamless pipe often used in this application inherently has shape and wall thickness deviations, complicating efforts to reduce Hi-Lo and leading to pipe-end dimensional data being used in various ways to achieve best fit-up.
Available solutions include counterboring, optimized by the use of 2-D geometrical data for pipe ends, end matching and rotation schemes, based on pipe end geometry, and a number of segregation-dynamic matching schemes.
Each weld on an SCR must be comprehensively checked to ensure no defects are present. Automated ultrasonic testing is normally used for this purpose and further constrains the fabrication process. AUT calibration blocks are necessary to ensure the ultrasonic inspection of the pipe weld is reliable.
The AUT equipment, however, must be checked with a calibration block commensurate with WT, a typical limit being WT within ±1 mm of the calibration block value. Variations in pipe WT outside the limit will require multiple AUT passes and multiple calibration cycles with appropriate calibration blocks.
The length of time to scan a weld and check resulting data lies within pipe welding cycle time if a single calibration block is used. WT outside this range, however, will cause the AUT inspection to take longer than the weld cycle time and delay the project, leading to the possibility of using pipe-end dimensional data to optimize assembly based on AUT considerations.
One solution is to quarantine pipe that cannot be inspected with a single AUT pass. Another approach is to plan assembly such that pipes requiring multiple AUT passes are welded into doubles or quads onshore while the ends of the doubles or quads are selected to require only a single AUT pass during offshore operations.
Measuring equipment
Differences between the type of data obtained with traditional calipers and the type of data obtained with a laser profiling tool are important. Both types of measurement can, if carefully carried out, yield the required accuracy. The data generated via calipers, however, remain a series of separate measurements.
A laser profiling device, by contrast, rotates laser measurement heads around a fixed axis. All measurements thus refer to the same axis system and can be combined to form a 2-D map of the pipe-end geometry, allowing for analysis that takes the actual pipe shape into account.
The optical metrology tool measures more than 2,000 internal and external points along the pipe's circumference in around 10 sec. Analyzing measurement data allows planning for a particular assembly approach to suit the requirements of a given project. End matching, for example, can find a sequence of pipes to allow constructing strings capable of meeting the 0.5-mm criteria without counterboring. Alternately, a counterbore plan using groups of counterbore diameters such that the maximum amount of material removed and minimum remaining could be optimized with applicable Hi-Lo and WT limits, could ensure required uniformity.
Either method would take all AUT requirements into account to manage pipes outside the optimum AUT calibration range.
The fit-up process brings pipes together in an alignment before welding. Dimensional data can mark each pipe end with a rotation mark so that pipes can be rotated directly into the optimal position to minimize fit-up Hi-Lo. A clamp temporarily holds pipes in the correct position for welding.
Field example
This example required measuring a set of 20-in. OD UOE pipes that were to be used as a deepwater export SCR in the Gulf of Mexico. OMS measured the various pipes for the project including:
• Measurement of 16 ft by 20-in. OD pipes in Rotterdam before fatigue testing.
• Provision of fatigue sample fit-up sequence.
• Measurement of fatigue samples to assess postwelding Hi-Lo.
• Measurement of fatigue sample pipes following testing.
• Measurement of 298 pipes in Louisiana for primary and secondary string.
• Measurement of forgings.
• Computation of primary and secondary SCR strings.
• Contingency planning.
• Offshore support onboard pipelay vessel (S-lay), including ability to analyze contingency pipes.
Analysis of measurement data followed the measurement stage. Early measurement and analysis revealed the UOE pipes ordered for the project to be difficult to match together to specified requirements due to their geometry. Engineers agreed on a variation of the project's Hi-Lo requirement to 0.7 mm Hi-Lo for no more than 20 mm around the pipe circumference.
With the variation in place, further analysis determined a specific sequence of pipes and rotation angles between pipes capable of achieving the new Hi-Lo. Further study determined the best contingency was to ship pipe from the secondary string to replace any of the pipes in the primary string if needed. A set of identified pipes was mobilized offshore along with the primary string and a contingency plan.
Marking the required rotation positions onto pipe ends allowed quick shipboard alignment of the corresponding marks to achieve the optimum rotation before welding. Fig. 2 shows the alignment marks as the pipes are rotated to the correct position.
Pipes reach proper welding position (minimum Hi-Lo) when the black lines have been rotated into alignment with one another (Fig. 2).
The rotation procedure together with the sequencing of the pipes onto the vessel and into the firing line delivered the optimized array for both primary and secondary strings.
OMS personnel supervised the fit-up on board the S-lay vessel and were on standby to remeasure pipes or determine the correct contingency pipe to be used in the event of any problems in the fit up of the pipes.
Project outcomes included:
• Fit-up of the pipes aboard the pipelay vessel was considered excellent by all personnel involved, from AUT inspectors to the quality-control inspectors.
• Fit-up-related welding problems were completely avoided.
• Measurement of the Hi-Lo achieved aboard the pipelay vessel was compared with the predicted results from the OMS software (Fig. 3).
The majority of Hi-Lo measurements aboard ship lay well within predicted ranges (Fig. 4). In a small number of cases yielded Hi-Lo values were greater than predicted (though still within specification), which was attributed to one of two factors:
• Pipes were not always rotated optimally as requested.
• The lineup clamp did not always achieve optimum location of the pipes with respect to each other.
SCR counterbore
Sometimes pipe matching and rotation are insufficient to achieve required Hi-Lo. OMS conducted pipe-end measurements in Norway to help plan the counterboring process for a set of risers in a Gulf of Mexico project, 675 SCR pipes and 182 fatigue-sensitive flowline pipes. The pipe measurement survey occurred in a coating yard over 6 days, with up to 230 pipes/day measured. Fig. 5 shows the pipes' WT variation.
Following completion of the measurement phase, computer analysis determined a set of counterboring parameters for fatigue-sensitive SCR's. Pipe ends are generally different from each other in both size and shape, and in this case analysis showed groups of pipes with the same counterbore diameter as providing the best solution.
The project called for a maximum 0.5-mm Hi-Lo after counterboring. Variations of up to 0.2 mm in ID size and more than 0.5 mm in misalignment can easily occur and have to be modeled and accounted for in counterboring, prompting a material safety margin of 0.5 mm to be configured into the simulation. Where pipe ends attain consistently poor geometrical conformity, this safety margin cannot always prevent a partial counterbore occurring, but an allowance for a small proportion of partial counterbores can be a useful option as part of overall optimization.
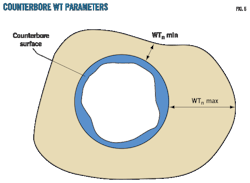
Fig. 6 shows the values requiring consideration when planning the counterboring of these pipes (scale exaggerated).
The operator first analyzed pipe-end statistics for ID, OD, and WT generated from measurement data to determine initial counterboring diameter candidates. This analysis drove a simulation in which 2-D pipe-end geometry was modeled during counterboring to find postcounterbore WT and the amount of material removed.
Analysis also sought to find pipes on which both ends would be able to meet the applicable criteria. Grouping these pipes sought to limit the material removed during counterboring to less than 1.0 mm. Pipes unable to meet the initial criteria then served to select a second group with a larger counterbore-size parameter and so on until all pipe counterbore sizes were determined.
Iterative optimization occurred across the entire process. Measurements representing the full 2-D pipe-end geometry act as the fundamental enabler of this type of optimization.
Eccentricity is often the biggest factor in allocating pipes into groups. Pipes with the smallest counterbore size are often the pipes with the best concentricity between outer and internal geometries.
Fig. 7 shows the results of selecting five different counterboring sizes and the effect on the material removed from the pipe under perfect centering conditions. Counterboring removed a minimum of 0.5 mm from each pipe end up to a maximum of more than 1.0 mm. One end of a pipe can often have more material removed because of the need to have the same counterboring size for both ends despite differing ID and shape from end to end.
Full 2-D pipe-end measurement data allow simulation of the various factors involved in optimizing counterboring to find the best compromise solution. The optimal solution avoids the need to remove large amounts of material while including an allowance for machining tolerances, avoiding partial counterbores as a matter of practice.
The authors
More Oil & Gas Journal Current Issue Articles
More Oil & Gas Journal Archives Issue Articles
View Oil and Gas Articles on PennEnergy.com
