Special Report: Midyear Forecast: US energy demand gears up for expansion
Demand for oil and gas in the US will climb this year, boosted by tepid economic growth. Buoyed by relatively low prices and recovering industrial demand, the natural gas market will expand more than demand for oil in 2010.
All major sources of energy will post an increase in use, rebounding from last year's 5% contraction. Worldwide oil demand also will regain momentum following last year's decline.
In the US, development of unconventional resources will drive 2010 gas production growth, while offshore fields will fuel this year's increase in oil production.
Worldwide oil demand
Economic recovery will push global oil demand this year to average 86.4 million b/d, according to the International Energy Agency. The agency's figures indicate that worldwide oil demand fell to average 84.8 million b/d during 2009, down 1.2 million b/d from a year earlier.
Oil demand tumbled last year in the industrialized countries of the Organization for Economic Cooperation and Development (OECD), where demand averaged 45.5 million b/d, down from 47.6 million b/d the previous year. This contraction in demand was caused by the economic recession that began in the second half of 2008.
In countries outside the OECD, demand for oil grew by 900,000 b/d in 2009 to average 39.3 million b/d, according to IEA, and the Paris-based agency forecasts that demand in those regions will continue to increase this year, averaging 40.9 million b/d. Oil demand in China and the Middle East spurred last year's growth.
Among non-OECD countries, IEA estimates that nearly all will record an increase in oil demand this year. China is forecast to post average demand of 9.2 million b/d, up from 8.5 million b/d last year. For this year's first half, IEA estimates that Chinese oil demand increased 13% from a year earlier, but others are less bullish.
London-based Centre for Global Energy Studies estimates that oil demand in China was up 5.3% in the first half but agrees that the country has been the main driver of global oil demand growth over the past 18 months.
Oil demand in other Asian countries outside the OECD will climb about 300,000 b/d to average 10.2 million b/d this year. IEA also forecasts increases in demand this year in the former Soviet Union (FSU), Latin America, and the Middle East.
OECD oil demand this year will be unchanged from 2009 at 45.5 million b/d, IEA forecasts. Demand in North America is set to increase to 23.6 million b/d, while oil demand in Pacific OECD countries will average 7.7 million b/d, unchanged from a year ago.
Amid weak economic conditions, OECD Europe is forecast to record another decline in oil demand this year to 14.2 million b/d, down from the 2009 average of 14.5 million b/d and a 2008 average of 15.3 million b/d.
Global oil supply
Worldwide oil supplies will average 86.7 million b/d this year, led by an increase in non-OECD output. IEA forecasts that non-OECD oil supply in 2010 will average 30.2 million b/d vs. last year's 29.3 million b/d.
Among this group of producers, the FSU and Latin America will post the largest supply increases. Non-OECD supply will climb this year as a result of new fields starting up and other fields ramping up production in Brazil, Russia, Azerbaijan, and Kazakhstan, IEA reported.
Chinese oil supply will climb to average 3.9 million b/d this year from a 2009 average of 3.8 million b/d, as output is unchanged from last year in non-OECD Europe, Africa, and non-OPEC Middle East countries, according to IEA figures.
OECD oil supply growth this year will be limited, as small gains in North America and Australia mostly offset a decline in OECD Europe. IEA forecasts that total OECD oil supply will average 19.5 million b/d this year, up from 19.4 million b/d last year.
OGJ forecasts that total oil supply from OPEC will grow this year to average 34.4 million b/d, as the organization's output of both crude and natural gas liquids increases from a year ago.
This average is based on IEA's forecast that OPEC members' NGL production will climb to a 2010 average of 5.4 million b/d, up from a 2009 average of 4.7 million b/d, and assumes that OPEC, including Iraq, will hold its crude output steady at 29 million b/d throughout 2010.
The result will be a global oil stockbuild of 300,000 b/d compared with last year's average 100,000 b/d addition of oil to storage.
US economy
OGJ forecasts that the US economy will expand at a rate of 3% this year.
The debt crisis in Europe has diminished hopes of a strong economic recovery, and as a result, low interest rates are holding. Investors have driven up the price of gold, seen as a safe investment in uncertain times.
The US Federal Reserve Bank's Federal Open Market Committee targeted the federal funds rate at below 0.25% in December 2008 in an attempt to limit economic deterioration in light of strained financial markets and tight credit conditions. The federal funds rate has been unchanged since then.
The US economy, measured by gross domestic product (GDP), expanded during the past three quarters. Figures from the US Bureau of Economic Analysis (BEA) show that in this year's first quarter, GDP—the output of goods and services produced by labor and property located in the US—increased 2.7% from fourth-quarter 2009, when the economy expanded by 5.6%.
Real personal consumption expenditures increased 3.5% in the first quarter, compared with an increase of 1.6% in fourth-quarter 2009, according to BEA.
Real exports of goods and services, meanwhile, increased 7.2% in the first quarter, compared with an increase of 22.8% in the fourth, while real imports of goods and services increased 10.4%, compared with an increase of 15.8% in the subsequent quarter, BEA figures show.
The unemployment rate in May fell to 9.7%, the level it had been for 2010's first quarter. Most of the jobs created during the month were temporary and tied to the US Census. Still, the private sector did show modest job creation, and a recovery is clearly under way, although it will be a slow one for the job market, said Jason Schenker, president of Prestige Economics, Austin.
"A slow recovery to the job market is something we have been expecting, and we continue to expect the unemployment rate to remain above 9.5% through the rest of the year, and we believe the unemployment rate will take years to fall to prerecession levels," Schenker said.
Energy by source
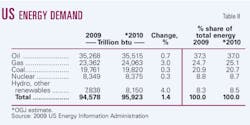
Demand for each major source of energy will rise this year from 2009, when each source except renewable energy declined.
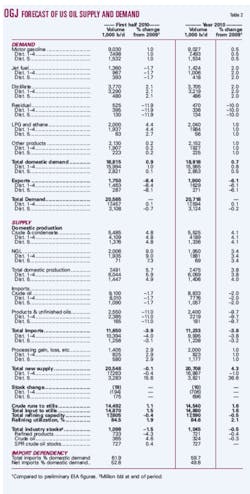
Oil demand in the US will climb just 0.7% this year to 35.515 quadrillion btu (quads). Petroleum products' share of the US energy market will contract a bit to 37%, even as demand for most products climbs from a year ago.
Gas consumption is set to rise 3%, up across all types of consumers, because prices are relatively low and temperatures in the US were cooler than normal in February. OGJ forecasts that gas demand this year will total 24.063 quads and account for just over 25% of all US energy supplied.
Coal prices have climbed a bit since late 2009, but gas prices are still higher than those for coal. This should help maintain coal demand this year. Demand for coal will total 19.82 quads, moving up just 0.3% from a year ago. This will result in a small loss in coal's energy market share to 20.7% from last year's 20.9% share.
The use of hydroelectric power and other renewable forms of energy will grow by the greatest percentage, up 4% this year, but this group will still account for the smallest share of the US energy market.
Renewables and hydroelectric power will comprise 8.5% of the US energy market, up from 8.3% a year ago, and is approaching the market share of nuclear energy, which this year will meet 8.7% of US energy needs. OGJ forecasts that US nuclear energy use will total 8.375 quads, up from last year's 8.35 quads.
Oil prices
Despite high inventory levels, crude prices retained their strength in this year's first half, as oil was seen as a safe investment and there was a sense of optimism that the US economy was growing apace. Oil prices over the remainder of this year should be determined by the extent of economic recovery and by demand for transportation fuels.
OGJ forecasts that the price of crude at the wellhead in the US will average $73.50/bbl this year. In 2009, the wellhead crude price averaged $56.39/bbl, down from $94.04/bbl a year earlier. Crude acquisition costs for refiners have moved along with wellhead prices and are forecast to average $77/bbl this year, a 30% increase from last year's average.
Average product prices in 2010 will be higher than last year's. OGJ forecasts that all types of motor gasoline will average $2.80/gal at the pump this year, up 17%. Residential heating oil, excluding tax, will average $2.77/gal, OGJ forecasts, up from $2.385/gal last year.
Since March 2009, when the retail price in the US averaged $2.092/gal, the on-highway diesel fuel price has trended sharply higher, surpassing the pump price of gasoline.
In May, the latest month for which data is available, diesel averaged $3.069/gal, according to EIA, with the highest prices in California and the Central Atlantic region of the US.
US gasoline demand
Gasoline demand will increase just 0.5% this year to average 9.027 million b/d. Higher pump prices appear to be limiting demand growth for motor gasoline, which has struggled to recover since reaching a low in September 2008 at 8.5 million b/d.
Gasoline demand in this year's first half was weak compared with year-earlier levels, but second-half 2010 demand should be stronger than a year earlier, given the marked demand weakness in the second half of 2009.
Current EIA figures show that during 2009, demand for gasoline was flat from a year earlier. In the June edition of its Short-Term Energy Outlook, EIA forecast that retail prices for regular-grade motor gasoline will average $2.79/gal during this summer's driving season of April through September, up from $2.44/gal last summer.
The most recent data from EIA regarding motor vehicle mileage, fuel consumption, and fuel rates are preliminary figures for 2008. These figures show that the number of miles traveled per vehicle for all types of motor vehicles that year dropped 2.5% to 11,619 miles. This was the steepest annual decline in mileage across all types of vehicles since 1979.
Other products
Demand for distillate fuel oil and biodiesel demand as well as demand for jet fuel are each set to increase 2% from last year, rebounding slightly but not returning to their 2008 levels.
OGJ forecasts that 2010 demand for distillate and biodiesel will average 3.7 million b/d. Most distillate demand, about 85%, is for ultralow-sulfur diesel and used for transportation, while the remaining demand is for heating oil.
Last year demand for distillate fell 8%. Demand for distillate declined among residential, commercial, transportation, and industrial customers, but use last year by electric power customers was little changed from 2008.
Jet fuel demand will average 1.424 million b/d this year, up on increased business and leisure travel. Most of this growth will occur in the second half of 2010 compared with very weak demand in second-half 2009. Jet fuel demand for all of last year was down 9% from 2008.
Demand for residual fuel oil is forecast to decline 10% this year to average 470,000 b/d. Resid demand moved lower last year among electric power, commercial, industrial, and transportation consumers.
US demand for liquefied petroleum gases will increase for the second year in a row. LPG demand was the only major petroleum product to register an increase in average demand in 2009. Demand for LPG feedstocks, including propane, ethane, and normal butane, climbed in the second half of last year on the upswing in economic activity (OGJ, Mar. 8, 2010, p. 40).
Demand in 2010 for all other petroleum products will be little changed from last year, up 1% to average 2.15 million b/d. These products include kerosene, lubricants, petroleum coke, aviation gasoline, and asphalt and road oil.
Oil production
OGJ forecasts that US oil production will increase almost 4% this year following last year's jump by nearly 7%. Production of crude and condensate in the US this year will average 5.525 million b/d, and production of natural gas liquids will increase to average 1.95 million b/d.
The US Energy Information Administration forecast in its latest short-term outlook that oil production from the US Gulf of Mexico will drop by 26,000 b/d during the fourth quarter and 70,000 b/d during 2011 as a result of the Obama administration's 6-month moratorium on deepwater drilling (OGJ Online, June 8, 2010).
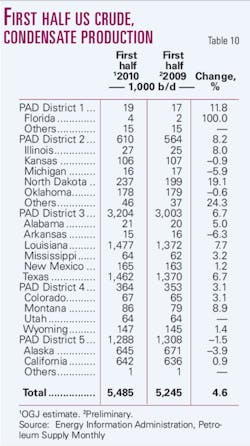
In the first 6 months of this year, production of crude and condensate increased by an estimated 4.6% from a year earlier to 5.485 million b/d, according to early estimates. Driving oil production growth are offshore fields in the US Gulf of Mexico, including Atlantis, Shenzi, Tahiti, and Thunder Horse fields.
Production increases in North Dakota, Louisiana, Montana, and Texas offset declines in Alaska, where output fell to average 645,000 b/d in the first half from 671,000 b/d in the first half of 2009.
Trade
US oil imports will shrink for the fifth consecutive year, averaging 11.2 million b/d this year. Crude imports will decline 2% to 8.8 million b/d, while imports of petroleum products will fall almost 10% from last year to average 2.4 million b/d.
In total, imports will supply almost 60% of US oil demand this year, OGJ forecasts. Last year imports met 62.5% of US demand for oil.
The leading source of US crude and product imports during 2009 was Canada, followed by Mexico. Venezuela was the third-leading source of US oil imports last year, followed by Saudi Arabia, Nigeria, and Russia.
OGJ forecasts that US exports of crude and products will decline from last year's unusually high average of more than 2 million b/d. Exports will average 1.9 million b/d this year, which is still up from the 2008 average of 1.8 million b/d.
Oil inventories
OGJ calls for total oil demand in the US to slightly outweigh new supply this year, leaving oil inventories a bit lighter at yearend. At this year's midpoint, total inventories of commercial crude, crude in the Strategic Petroleum Reserve (SPR), and petroleum products are about even with their midyear 2009 total.
Product stocks will total 721 million bbl, down from a yearend 2009 total of 724 million bbl. This stock draw contrasts with the inventory build that most products experienced during the demand weakness of 2009.
Commercial crude stocks will finish 2010 at 324 million bbl, down from 325 million bbl a year earlier. The volume of oil in the SPR will close out 2010 at 727 million bbl, the same as yearend 2009.
Refining
Refining activity will improve this year, but results still will be weak. Reduced demand for petroleum products drove down refinery utilization and refining margins in 2008 and 2009, leading some refineries in the US, as well as in Europe, to close. Meanwhile, refining capacity continues to increase in Asia and the Middle East.
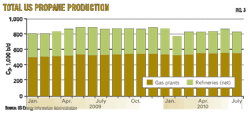
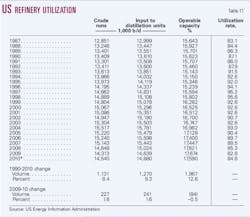
In the US, capacity rationalization at refineries will result in an increase in utilization rates from a year ago. Utilization will average 84.6% this year at US refineries, up from last year's 82.8% when production of all major products except propane declined from 2008.
First-half 2010 cash refining margins were up marginally from a year ago for refiners in the US East Coast, Gulf Coast, and Midwest regions, according to figures from Muse, Stancil & Co., but West Coast refiners posted lower cash operating margins from first-half 2009.
OGJ forecasts that operable capacity at US refineries will average 17.59 million b/d this year, down from 17.674 million b/d a year ago. Total inputs will climb 1.6% to average 14.88 million b/d.
Natural gas market
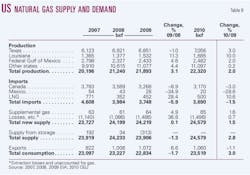
US gas demand will rebound this year after contracting during 2009, a year marked by gas production growth. Total US gas production this year also will increase to total 22.32 tcf.
EIA estimates indicate that US marketed gas production rose last year to 21.893 tcf, boosted by growth in unconventional gas output in shale plays such as the Haynesville and Marcellus. The US recorded the world's largest increase in production for the third consecutive year, surpassing Russia as the world's largest gas producer, according to the annual BP statistical review of world energy.
But BP noted that worldwide gas production decreased last year for the first time on record, down 2.1% due to declining consumption.
In 2009, US gas production climbed 3.1%, according to EIA. Production growth in the Gulf of Mexico was strong due to many projects coming online and as a result of volumes returning online after Hurricanes Gustav and Ike in 2008 shut in production.
US gas imports are set to decline 1.5% this year, following last year's nearly 6% decline, which was mostly due to a decrease in imports from Canada, although gas imports from Mexico also were down from 2008. US LNG imports last year increased 28% to 452 bcf on weakened demand in Europe.
OGJ forecasts that LNG imports this year will climb again, reaching 500 bcf. US gas imports this year from Canada and Mexico, however, will continue to fall, as those countries require the gas for domestic use, notably in the production of Canada's oil sands.
The amount of gas in storage at the end of 2010 will be unchanged from a year earlier. During 2009, total supply outweighed demand such that 313 bcf of gas was added to storage. This compares with a 2008 net withdrawal of gas from storage of 34 bcf.
OGJ forecasts that the US wellhead gas price will average $4.20/Mcf this year. This is up from $3.71/Mcf in 2009, but still well below the 2008 average price of $7.96/Mcf.
Despite last year's weak gas demand and prices, gas-directed drilling activity began to ramp up in July 2009 along with oil-directed rigs. Gas plays continued to be developed because of sunk costs at higher cost unconventional plays and because companies needed to drill to hold their leases.
More Oil & Gas Journal Current Issue Articles
More Oil & Gas Journal Archives Issue Articles
View Oil and Gas Articles on PennEnergy.com
