During 1977-2007, 690 oil and gas fields in Louisiana terminated production. We classify these fields by product type, location, and year of termination, and summarize end-of-life production and adjusted gross revenue statistics.
The economic limits of oil and gas fields in state waters are two to six times greater in dollar value than fields in South Louisiana, and fields in the South have economic limits about two to five times greater than fields in the North. We also show that gas fields turn marginal sooner than oil fields throughout the state.
During the last year of production, average oil field revenues varied from $35,000 in North Louisiana to $101,000 in South Louisiana to $227,000 offshore; gas field revenue thresholds ranged from $57,000 (North Louisiana) to $402,000 (South Louisiana) to $936,000 (offshore).
Daily oil production the last year of operations ranged from 2.6 b/d of oil equivalent (North) to 7.6 boe/d (South) to 25.2 boe/d (offshore). Daily end-of-life gas production rates ranged from 41 Mcfd of gas equivalent (North) to 236 Mcfe/d (South) to 476 Mcfe/d (offshore).
Resources and production
Drilling for oil took place in Louisiana as early as 1866, but it was not until the success at Spindletop in Southeast Texas that drillers returned to Louisiana and discovered oil at Jennings, about 90 miles east of Beaumont.
Through 1920, Jennings field accounted for about two-thirds of Louisiana oil and gas production. Exploration moved into the marsh and swamp lands of South Louisiana, and by 1937, wells were drilled at Ferry Lake, and by the mid-1940s, operations were being conducted offshore in the Gulf of Mexico. Production offshore in state waters began in 1955.
Oil production rose rapidly in the 1960s and has been in steady decline since peaking around 1970 at 1.35 million b/d (Fig. 1). Today, oil production is 24% of its 1965 peak in North Louisiana, 12% of its 1970 peak in South Louisiana, and 9% of its 1970 peak in state waters.
Gas production has followed similar trends, but in recent years success in the Haynesville shale in North Louisiana has slowed the decline (Fig. 2). South Louisiana and state waters gas production, however, continues to decline.
Most oil is produced in South Louisiana with gas equally divided between North and South. Offshore state waters production has never exceeded more than 10% of state production.
Louisiana currently ranks fifth in the US in oil production and fourth in gas production. In terms of reserves, Louisiana contains about 2% of US proved oil reserves, 5% of its proved gas reserves, and 3% of its natural gas liquid reserves.
Field statistics
Data source
The Louisiana Department of Natural Resources Office of Conservation maintains a database of drilling and production data through the Strategic Online Natural Resources Information System (SONRIS).1
Gas production data are expressed as marketable gas, nonassociated, and casinghead, adjusted to exclude reinjected gas, extraction loss, and nonhydrocarbon gases. Crude oil production includes natural gas liquids and lease condensate.
Field data include crude oil and natural gas production from 1977 to present for onshore and offshore waters. State waters extend 3 nautical miles from the coastline.
The data set consists of 1,698 fields. Some 1,220 fields were discovered and started producing before 1977, and 478 fields started producing after 1977. A total of 52 fields do not have a discovery year identified; for these fields we assume production starts after 1976 and use the first producing year after 1976 as the discovery year.
Producing fields
Over time, producing fields deplete and stop production as new fields are discovered and start production. New field discoveries are defined by their year of discovery which normally, but not always, coincides with the first year of production.
The number of new discoveries and producing fields minus the number of fields that terminate production determines the net change in the number of producing fields during the year.
In 1977 there were 1,183 producing fields in the state: 474 oil fields and 709 gas fields (Table 1).
In 2008, 994 fields were producing: 398 oil fields and 596 gas fields.
In Fig. 3, the total number of producing fields over time is displayed along with the number of terminated and discovered fields. The number of terminated fields falls below the axis, while the number of new discoveries falls above the axis. Since 1983, the number of producing fields has been on a slow but steady decline.
Terminated fields
A total of 690 fields terminated production between 1977 and 2007: 258 oil fields and 432 gas fields (Table 2).
In state waters, 8 oil fields and 55 gas fields have terminated.
Terminated fields represent the sample population for our analysis.
The number of onshore fields is believed to be sufficiently large to yield useful and reliable information, while offshore fields—especially oil fields—are too few in number and may be subject to sample selection bias, that is, average statistics may not be representative of economic limits.
Production, revenue thresholds
Gross revenue thresholds
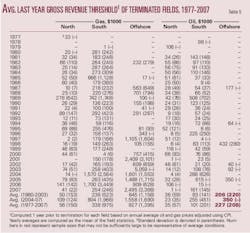
The average adjusted gross revenue for terminated oil, gas, and oil/gas fields 1, 2, 3, and 5 years before their last year of production is summarized in Table 3.
Gross revenues are computed based on annual oil and gas prices adjusted using the Consumer Price Index (CPI) over the time period 1981-2007.
Because of variation in factors such as the size and age of the field, production mechanism, operator type, and other variables that we did not (could not) control for, we expect the standard deviations to be significant, and indeed, within each category the standard deviation terms exceed the mean values. Significant spreads indicate that other factors besides location and product type contribute to the variation observed.
Offshore oil production statistics are reported, but because only eight fields comprise the data set, the sample average may not be representative. One offshore oil field was dropped from analysis because facilities were destroyed by a hurricane event and the field exhibited unusually high values (the statistics were two orders of magnitude larger than the second highest values calculated). No other filtering was performed.
End-of-life production represents the tail end of a decline curve, and as the time horizon expands from one to two and more years from the end of production, the gross revenues are expected to increase if the sample sets do not change. This is observed for all cases.
Average trends are reasonably consistent within each categorization and indicate that the revenue thresholds of offshore oil and gas fields dominate onshore fields; fields in the South turn marginal (uneconomic) sooner than Northern fields; and gas production turns uneconomic sooner than oil production. The transition from oil to oil/gas to gas production is also reasonably well-behaved across each of the statistical measures.
Specifically,
• Onshore, oil fields have a lower revenue threshold than gas fields, presumably because oil is more valuable and will produce to lower levels before being abandoned.
• Oil (gas, and oil/gas) fields in North Louisiana produce to a lower economic limit than oil (gas, and oil/gas) fields in the South because of the environmentally sensitive wetlands in the South and the increased cost of operating in the region.
• Offshore oil and gas fields have an economic limit about twice the level of onshore production in the South because of the greater fixed and variable costs associated with operating offshore.
• Offshore oil production has an economic limit smaller than offshore gas production reflecting the premium paid for oil, lower operating expenditures relative to gas production, or both.
• The ratio of the revenue threshold levels by location for oil fields is 2.3 (offshore/South) and 2.9 (South/North). For gas fields, the revenue threshold ratios are 2.3 (offshore/South) and 7.1 (South/North). For oil/gas fields, the revenue threshold ratios are 5.8 (offshore/South) and 3.2 (South/North).
• The gas to oil gross revenue threshold ratio varies between 1.6 (North) to 4.0 (South, offshore).
• Average oil revenue thresholds the last year of production ranged from $35,000 in North Louisiana to $101,000 in South Louisiana to $227,000 offshore in state waters. Gas revenue thresholds ranged from $57,000 (North Louisiana) to $402,000 (South Louisiana) to $936,000 (offshore).
• Average oil revenue thresholds during the last 3 years of production ranged from $82,000 in North Louisiana to $231,000 in South Louisiana to $1.0 million offshore. Gas revenue thresholds ranged from $119,000 (North Louisiana) to $808,000 (South Louisiana) to $2.5 million (offshore).
Production thresholds
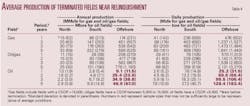
In Table 4, the average annual and daily production levels for abandoned fields are depicted 1, 2, 3, and 5 years before termination. For oil fields, associated gas is converted to barrels of oil equivalent and included as production; for gas fields, condensate is converted to cubic feet equivalent and included in the gas stream.
The same general trends observed in Table 3 with respect to location and product type recur in Table 4 because gross revenue is derived from production and price.
In brief:
• Oil fields in the North averaged 1,000 bbl/year of production during the last year of their life, or about 2.6 boe/d. Gas fields in the North averaged 15 MMcfe/year production, or about 41 Mcfe/d, during their last year.
• Oil fields in the South produced 2,800 bbl, or about 7.6 boe/d, at the end of their life. Gas fields in the South terminated at a production level of 86 MMcfe/year, or about 236 Mcfe/d.
• Offshore oil fields realized 9,100 bbl, or about 25 boe/d during their last year of operation. Gas field production during their last year averaged 174 MMcfe, or about 476 Mcfe/d.
Time trends
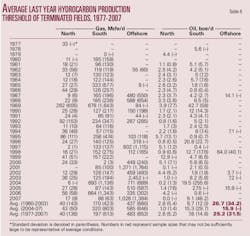
Average gross revenue and production thresholds the last year of production are computed in Tables 5 and 6.
In the last three rows of each table, averages are computed based on data from 1980-2003, 2004-2007, and 1977-2007.
In recent years, the gross revenue thresholds for gas fields are two to three times historic levels. Oil fields also reflect the run-up in oil prices during this time and vary by location. Production thresholds are somewhat less volatile relative to revenue thresholds because the influence of price variation is removed from analysis.
In Figs. 4-9, the gross revenue statistics are depicted using a one standard deviation interval. The midpoint of the interval depicts the average bound above and below by one-half standard deviation.
In Fig. 4, North Louisiana annual gross revenue thresholds for oil and gas fields are shown. The economic limit for gas fields tends to be larger than oil fields, but for some years, oil thresholds exceed gas thresholds.
In South Louisiana, gas thresholds usually dominate oil thresholds, indicating that gas fields are turning unprofitable earlier or that gas is not as valued a commodity as oil, or both (Fig. 5).
In Figs. 6 and 7, the data in Figs. 4 and 5 are averaged using 5-year interval blocks. This simplifies the presentation and allows general trends to be more easily discerned.
In North Louisiana, there is greater parity between oil and gas fields with oil field thresholds exceeding gas thresholds in two time blocks (1982-1986, 1997-2003) indicating a common cost outlook between the two commodities. In South Louisiana, gas fields dominate on average.
North Louisiana gas field gross revenues mostly dominate oil field revenues, and in the South, the difference between the two products is apparent. Note also the differences in the scales between the North and South.
In Figs. 8 and 9, fields are compared by location. Operations in the North have a lower revenue threshold over time, as expected, indicating lower field operating cost across both oil and gas operations.
Operating cost comparison
Oil and gas lease operating cost for North and South Louisiana and the federal waters of the Gulf of Mexico are estimated by US Energy Information Administration staff engineers using cost indices and survey data.
Near the end of production, a field will normally be producing from only one or two wells, and so a one-well lease and structure is considered for comparison.
We expect operating cost to increase over the life cycle of production, and so near abandonment, operating cost should be less than the economic limit statistics. The empirical data shown in Table 7 reasonably support this conclusion.
The computed ratios are within order-of-magnitude estimates and vary from 1.0 to 2.0 for onshore oil leases and 1.2 to 5.8 for onshore gas leases.
The EIA survey data for offshore operating cost appear to be overestimated, but because the values are calibrated to 2006 and the impact of cost inflation has not been included, this may influence the comparison. The impact of scale effects and normalization will also play a role.
Next: OCS economic limits.
Reference
1. (http://sonris-www.dnr.state.la.us/www_root/sonris_portal_1.htm).
Egypt
Dana Gas Egypt plans to test a new zone in Al Baraka field on Kom Ombo Block 2 in southern Egypt.
Preliminary analyses of cores from the Al Baraka-6 well, TD 5,035 ft in the Six Hills formation, reveal an estimated 30 ft of net pay in the Cretaceous Abu Ballas formation and 75 ft in the underlying Cretaceous Six Hills F formation.
The estimated Six Hills F pay shows significant thickening and contains two zones, the upper zone which shows lateral communication with Al Baraka 2 and the lower is a new zone. Completion and testing operations are planned on the Six Hills F lower zone. The Six Hills E sands appear absent in this well.
Dana Gas cut nine cores totaling 600 ft to help in design of a frac program of existing producing wells and future wells. From Al Baraka-6, first of a 10-well 2010 program, the rig will move to Al Baraka-5.
Interests in the concession are Dana Gas Egypt 50% and Sea Dragon Energy Inc., Calgary, 50%.
India
Reliance Industries Ltd., Mumbai, said its sixth oil discovery on the CB-ONN-2003/1 exploratory block in India's Cambay basin flowed 415 b/d of oil from the Miocene Basal sand of the Babaguru formation.
The CB10A-T1 well, in Part A of the block, produced from 1,390-95 m on a 6-mm bean with 290 psi flowing tubinghead pressure. TD is 1,500 m. The discovery is dubbed Dhirubhai-49.
Philippines
ExxonMobil Exploration & Production Philippines BV has spud the Palendag-1 exploratory well in the deepest water drilled off the Philippines.
The well is in 6,362 ft of water in the Sulu Sea on Service Contract 56 east of Borneo in the Sandakan basin. It is the third well in the block.
ExxonMobil drilled Dabakan-1 to more than 16,000 ft and Banduria-1 to 13,534 ft between October 2009 and February 2010. Those two wells, 22 miles apart, are discoveries of unspecified magnitude (OGJ Online, Jan. 22, 2010).
The ExxonMobil subsidiary has a 50% participating interest in SC 56. Other interest holders are Mitra Energy (Philippines SC-56) Ltd. and BHP Billiton Petroleum (International Exploration) Pty. Ltd. each 25%.
Colorado
Petroleum Development Corp., Denver, plans to drill its first horizontal well in the Cretaceous Niobrara formation in northeast Colorado in late 2010.
The company signed a purchase agreement to increase its position in the Wattenberg Niobrara to 70,000 acres, 92% held by production. Closing is set for June 25.
The company recently signed a definitive agreement to add 5,500 net acres of leasehold in Wattenberg field in Weld County 10 miles northeast of its core Wattenberg operations.
PDC is developing plans for continued horizontal drilling on its existing Wattenberg acreage in 2011-12.
Rex Energy Corp., State College, Pa., said it has leased or taken farmouts on 20,000 net acres to explore for oil in Cretaceous Niobrara shale in the Denver-Julesburg basin.
The company expects to spud the first of two horizontal wells in the third quarter of 2010. The leases, which averaged $215/net acre, are in Weld County, Colo., and Laramie County, Wyo. The company continues to lease.
More Oil & Gas Journal Current Issue Articles
More Oil & Gas Journal Archives Issue Articles
View Oil and Gas Articles on PennEnergy.com
