OGJ FOCUS: GULF COAST ECONOMIC LIMITS—2: Limits compared for Texas coast, bays-estuaries, state waters
In Part 2 of this four-part series, we compute economic limits in Texas based on 16,045 oil and gas fields that terminated production between 1993 and 2008.
We classify fields by product type, location, and year of termination, and compute end-of-life production and adjusted gross revenue statistics.
We demonstrate that the revenue thresholds of oil and gas fields in state offshore waters are greater than the economic limits of fields located in bays-estuaries and on land. Further, we show that gas fields turn marginal sooner than oil fields.
During the last year of production, adjusted oil field revenue varied from $65,000 on land and bays-estuaries to $181,000 offshore; gas field revenue thresholds ranged from $384,000 (land) to $589,000 (bays-estuaries) to $637,000 (offshore).
Daily oil production the last year of operation ranged from 5 b/d of oil equivalent on land and bays-estuaries to 14 boe/d in state waters. Daily end-of-life gas production ranged from 215 Mcfd (land) to 258 Mcfd (bays-estuaries) to 416 Mcfd (state waters).
Resources and production
The first oil well in Texas was drilled near Oil Springs in Nacogdoches County in 1866.
Small amounts of production occurred in the late 1880s and early 1890s, and in 1894, oil discovered near Corsicana led to commercial production. The state's first major oil boom began in 1901 with the discovery of Spindletop near Beaumont.
In 2009, Texas produced an average of 900,000 b/d of oil and 19 bcfd of gas, accounting for 20% of US crude production and nearly one third of gas production.
In terms of earnings, defined as the sum of wages and salary disbursements, proprietor's income, and supplements to earnings, Texas generated nearly $65 billion, more than half of the total earnings generated nationally by oil and gas activity in 2008.1
Oil production peaked in 1972 at 3.4 million b/d and thereafter has been on a steady decline (Fig. 1). Today, oil production is about 25% of its peak level.
Gas production peaked in 1972 at 9.6 bcfd and after a period of decline and stagnation began to increase in 2005 due to production in the Barnett shale and other formations (Fig. 1). Today, gas production in Texas is about 80% of its peak level.
The discovery of the Barnett shale, the largest US gas field by production, launched a nationwide boom that has led to the identification of large areas of gas in shale formations in Louisiana, Arkansas, Pennsylvania, and elsewhere, which continues to reshape and transform domestic markets.
Texas crude oil reserves represent about one fourth of the US total and gas reserves account for over three tenths of the US total.
Land production is responsible for the vast majority of oil and gas produced in the state; bays-estuaries and state offshore waters provide less than 1% contribution (Figs. 2 and 3).
Field statistics
Data source
The Texas Railroad Commission maintains a database of drilling and production data for wells, including wells on state, private, and federal leases.2
Field data include crude oil and natural gas production in electronic form from 1993 to present classified according to product type (oil, gas, oil/gas), location (district), and terrain (offshore, bays-estuaries, land). State offshore waters extend 3 marine leagues (about 9 geographic miles) from the coastline.
The process of classifying a field as an oil field, gas field, or oil and gas field depends initially on the gas-oil ratio (GOR) of the first well but may also result from administrative hearings.
Gas production data are expressed as marketable gas, nonassociated and casinghead, adjusted to exclude reinjected gas, extraction loss, and nonhydrocarbon gases. Crude oil production includes natural gas liquids and lease condensate.
Producing fields
Over time, producing fields deplete and stop production as new fields are discovered and commence production.
The number of new discoveries and producing fields minus the number of fields that terminate production determines the net change in the number of producing fields during the year.
In 1993, the state had 21,312 producing fields: 8,301 oil fields, 7,778 gas fields, and 5,189 oil/gas fields (Table 1).
By 2008, 18,212 fields were producing: 6,639 oil fields, 6,957 gas fields, and 4,616 oil/gas fields.
Most discoveries occur on land, and in South Texas in bays-estuaries and state waters, the region is gas prone. In 2008, 18,036 producing fields were land-based, 86 fields exist in bays-estuaries, and 90 fields occur in state waters.
From 1993 to 2008, a total of 12,092 fields was discovered and 16,085 fields terminated.
The total number of producing fields over time is displayed along with the number of terminated and discovered fields (Fig. 4). Terminated fields are depicted below the axis; new discoveries are shown above the axis. Since 1993, the number of new discoveries has been decreasing while the number of terminated fields has been reasonably constant at around 1,000/year (Table 2).
Terminated fields
Between 1993 and 2008, a total of 16,085 fields in Texas terminated production: 4,634 oil fields, 8,731 gas fields, and 2,680 oil/gas fields (Table 3).
The vast majority of field terminations have been land-based. Offshore, 223 fields have terminated: 193 gas, 23 oil, and 7 oil/gas. In bays-estuaries, 156 fields terminated: 36 oil, 86 gas, and 34 oil/gas.
Terminated fields are the sample from which the economic limit statistics are computed. If sample sizes are not sufficiently large, the imputed statistics may not be representative. Therefore, in Table 3 and subsequent tables, computations that rely on small sample sizes are in red type to remind readers that the elements may not be representative of average conditions.
Aggregate statistics are presented regardless of sample size, and we recognize that irregularities may be due to sample size rather than be reflective of field characteristics. No data filtering was performed.
Fields located on land are well populated across all product types, and these statistics are the most reliable. Gas fields offshore and in bays-estuaries are also reasonably well populated, but oil fields and oil/gas fields offshore and in bays-estuaries are generally not well populated. For these categories the imputed statistics should be interpreted carefully.
Production, revenue thresholds
Gross revenue thresholds
The average adjusted gross revenue for terminated fields the last year and the last 3 years of production is summarized in Table 4 for oil, gas, and oil/gas fields by location.
Gross revenues are computed based on annual oil and gas prices adjusted using the Consumer Price Index (CPI) over the time period 1993-2008.
Within each category, the standard deviations are sometimes an order-of-magnitude greater than the mean values, and this is to be expected because we are only controlling for two factors when many factors influence the system.
Significant spreads indicate that other factors besides location and product type contribute to the variation observed.
End-of-life production represents the tail-end of a decline curve, and as the time horizon of the analysis expands from one to two and more years, the gross revenue statistics will increase if the sample sets remain populated with the same fields.
The revenue thresholds increase as the time horizons expand from the 1-year to 3-year average, as expected.
Average trends are reasonably consistent within each categorization, indicating that the revenue thresholds of offshore oil and gas fields dominate bays which (mostly) dominate onshore fields. Gas fields turn marginal sooner than oil fields, and oil/gas fields exhibit hybrid characteristics of oil and gas fields.
Some highlights of the empirical results:
• Oil and gas fields on land produce to a lower economic limit than oil and gas fields in bays-estuaries, which produce to a lower economic limit than offshore fields reflecting the increased cost associated with harsher environmental conditions.
• Oil fields offshore have an economic limit about three times greater than onshore production presumably because of the greater fixed and variable costs associated with operating offshore.
• Gas fields in state waters have an economic limit about twice onshore production.
• Gas production has an economic limit 5 to 10 times greater than the economic limit of oil production indicating either greater operating cost for gas production or the impact of the oil premium.
• Average oil revenue thresholds the last year of production ranged from $64,000 on land to $66,000 in bays-estuaries to $181,000 offshore. Gas revenue thresholds ranged from $384,000 (land) to $589,000 (bays-estuaries) to $637,000 (offshore).
• Average oil revenue thresholds during the last 3 years of production ranged from $99,000 (land) to $83,000 (bays-estuaries) to $476,000 (offshore). Gas revenue thresholds ranged from $681,000 (land) to $950,000 (bays-estuaries) to $1.1 million (offshore).
Production thresholds
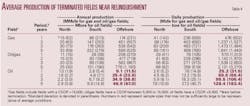
In Table 5, the average daily production levels for abandoned fields are depicted during the last year and the last 3 years before termination. For oil fields, associated gas is converted to boe and included as production; for gas fields, condensate is converted to cubic feet equivalent and included in the gas stream.
Table 5 trends are similar to those observed in Table 4 because gross revenue is derived from production and prices.
We observe:
• Oil fields averaged 5 boe/d on land and bays-estuaries during the last year of their life, and about 14 boe/d in state waters.
• Gas fields averaged 215 Mcfd (land), 258 Mcfd (bays-estuaries), and 416 Mcfd (state waters) during their last year of operation.
• Oil/gas fields average 95 Mcfe/d (land), 50 Mcfe/d (bays-estuaries), and 129 Mcfe/d (state waters) during their last year of operation.
Time trends
In Table 6, the average gross revenue the last year of production is depicted across time.
We compute the last year of revenue for each terminated field and then compute the average of all the fields that terminated during the year. In the last three rows of Table 6, averages are computed based on data from 1993 to 2004, 2004 to 2008, and from 1993 to 2008 to compare recent versus historic economic limits.
Similar statistics are presented for production data in Table 7.
In recent years, revenue thresholds have at least doubled in magnitude relative to historic trends, reflecting higher commodity prices and a rise in service cost. Operators are abandoning fields at higher revenues, but the absolute levels of production at abandonment have remained relatively stable.
In Figs. 5-7, the average gross revenue statistics are depicted the last year of production by product type and location across time.
In Fig. 5, oil field gross revenues over 3-year interval blocks are depicted across land, bays-estuaries, and offshore. Fields in state waters dominate fields on land and in bays-estuaries. In Figs. 6 and 7, trends for gas and oil/gas fields are depicted.
Where expected patterns are not observed, sample size problems are usually the cause.
In Figs. 8-10, we compare fields by product type. Land operations are the most consistent, with gas production having the highest thresholds and oil production the lowest. Oil/gas fields have revenue thresholds that usually fall between oil and gas fields reflecting their hybrid status.
In Tables 8 and 9, the average gross revenue and production statistics in Figs. 5-10 are summarized by primary product, location, and time horizon.
EIA operating cost comparison
Oil and gas lease operating costs for Texas are estimated by EIA staff engineers using cost indices and survey data.
Near the end of production, a field will normally be producing from one or two wells, and so a one-well lease is considered for comparison. Normalizing the EIA operating cost data to a one-well oil lease producing by artificial lift, a one-well gas well gas lease, and a one-well platform in state waters, we compute the ratio of the computed threshold to the EIA data (Table 10).
We expect that operating cost should be strictly less than the empirical data derived herein because end-of-life production cost will exceed normal operating cost. The results shown in Table 10 reasonably support this conclusion.
The computed ratios vary from 1.5 for onshore oil leases to 9.4 for onshore gas leases. For offshore gas leases the ratio is 1.1, and for offshore leases, below unity, likely reflecting survey data that are overestimated.
The EIA survey data are calibrated to 2006, and the impact of cost inflation has not been assessed. The impact of scale (normalization) may also play a role in the variation observed but was not considered.
Next: Louisiana economic limits
References
1. Snead, M.C., "Are the energy states still energy states?," available at: www.KansasCityFed.org.
2. Texas Railroad Commission (www.rrc.state.tx.us/data/index.php).
More Oil & Gas Journal Current Issue Articles
More Oil & Gas Journal Archives Issue Articles
View Oil and Gas Articles on PennEnergy.com
