Moderate economic growth will spur a small recovery in US energy demand this year.
Total US energy demand will grow less than 1% in 2010 on the heels of last year's 4% decline. Demand for oil, natural gas, and renewable energy sources will increase, while a slide in coal demand will add to last year's drop.
OGJ looks for oil prices to move more in line with market fundamentals this year. The 2009 rise in oil prices was tied to the prospect of an economic recovery and weakness in the US dollar more than to supply and demand levels.
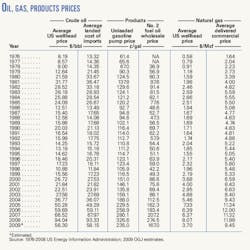
While the amount of US commercial crude oil in storage was robust during 2009, finishing the year above the yearend 2008 level, so were crude prices. The spot price of West Texas Intermediate averaged $77.99/bbl in November 2009, having climbed from an average of $39.09/bbl in February of that year.
Global oil demand
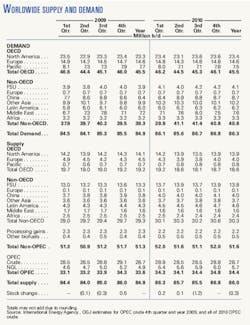
Oil demand in 2010 in Organization for Economic Cooperation and Development (OECD) countries will be unchanged from a year ago, averaging 45.5 million b/d, according to estimates from the International Energy Agency. But a 1.5 million b/d boost in demand from countries outside the OECD will cause total demand to climb.
Worldwide demand for oil this year will average 86.3 million b/d, rebounding from last year's average of 84.9 million b/d and nearly reaching the 2007 average of 86.5 million b/d.
IEA estimates that demand in OECD Pacific countries will slump a bit in 2010, but that demand in OECD North America will take up this slack. Outside the OECD, IEA expects a climb in demand in all areas except Europe, which will hold demand at an average of 700,000 b/d this year. The largest non-OECD increase in demand will be in the Middle East, where demand will average 7.6 million b/d, up from 7.2 million b/d last year.
In 2009, oil demand sank in North America to average 23.3 million b/d vs. 24.2 million b/d a year earlier. Demand averaged 14.6 million b/d in OECD Europe, down from the 2008 average of 15.3 million b/d.
Outside the OECD last year, collective demand grew. Chinese demand managed to climb to average 8.4 million b/d in 2009, up from 7.9 million b/d a year earlier. The only non-OECD region to post a contraction was the former Soviet Union, where demand averaged 3.9 million b/d vs. a year-earlier average of 4.2 million b/d.
Worldwide oil supply
Worldwide output of oil will increase this year to average 86 million b/d, compared with 84.9 million b/d last year and 86.4 million b/d two years ago.
All of the supply growth will come from non-OECD countries, as OECD output will shrink this year, according to IEA estimates. Crude and natural gas liquids production will decline in Mexico, Norway, and the UK.
Outside the OECD, IEA calls for oil output to increase in Brazil, Colombia, Oman, Russia, Azerbaijan, and China. Total non-OPEC, non-OECD supply will average 30.3 million b/d this year, up 1 million b/d from last year.
Including processing gains and other biofuels, IEA forecasts that 2010 non-OPEC supply will average 51.6 million b/d, up from last year's 51.3 million b/d.
IEA figures also show that NGL production within OPEC, which is not subject to the group's output ceilings, will continue to climb, averaging 5.7 million b/d this year. Last year the organization's NGL supply averaged 4.9 million b/d.
OGJ estimates that OPEC crude output will average 28.68 million b/d this year, nearly unchanged from 2009. Considering the current demand estimates, this would end in a stockdraw of 300,000 b/d for the year.
With oil prices near $80/bbl at the start of 2010 and economic recovery still weak in many industrialized countries, OPEC should be reluctant to cut its output ceilings any time soon. Despite full OECD oil inventories, an oil-price spike now could strike a blow to economic recovery in the US and elsewhere.
In 2009, OPEC crude supply averaged an estimated 28.73 million b/d, resulting in an average worldwide oil supply of 84.9 million b/d and no change in inventories.
US economy, energy
The economy's recovery will be tempered by a lack of jobs growth, as companies remain reluctant to hire in 2010 due to uncertainties about taxes and the availability of credit.
OGJ forecasts that the US economy will grow 3% this year, but jobs growth will be slow. The Bureau of Labor Statistics reported that for December 2009, the unemployment rate was unchanged from the previous month at 10%. However, the civilian labor force that month lost 661,000 persons. Had they been counted among the unemployed, the rate would have jumped above the October 2009 rate of 10.2%.
Some large retailers recently have reported better-than-expected results for late-2009, and General Motors announced earlier this month that it projects it will turn a profit this year, having exited bankruptcy just last summer with government assistance.
The National Association of Credit Management (NACM) reported this month that the economy remains weak, but headed in the right direction. The group's December Credit Managers' Index (CMI) matched the mood of the economy as a whole—essentially flat, but showing some mild progress.
NACM said the performance of the CMI looks solid compared with the doldrums experienced a year ago, but in a couple of months there will be an opportunity to compare recovery periods. There has been a consistent performance since April 2009, the report said, and by April 2010, there should be a more solid level of expansion. If this doesn't start to manifest itself there will be renewed fears of a double-dip recession, NACM said.
The US GDP last year declined 1%, falling 6.4% in the first quarter and 0.7% in the second quarter. The economy fell into recession during 2008, when GDP sank by 2.7% in the third quarter and then by 5.4% in the fourth quarter.
Meanwhile, the employment situation soured. In June 2007, the US unemployment rate was 4.6%. A year later it rose to 5.6%, then unemployment rose to 7.2% in December 2008. By June 2009, the US unemployment rate was 9.4%. These figures hid the fact that many in the US were underemployed, working part time or at jobs below their skill levels.
BLS reported that the number of people working part time for economic reasons was about unchanged at 9.2 million last month and has been relatively flat since March 2009. These individuals were working part time because their hours had been cut back or because they were unable to find a full-time job.
US energy demand will grow only 0.6% this year, OGJ forecasts, following last year's contraction to 95.4 quadrillion btu (quads) from a 2008 total of 99.4 quads. High energy prices, the weak economy, and high unemployment will keep a limit on this year's total energy demand.
Energy by source
Some sources of energy will incur modest demand increases this year, but others will be unchanged or lower from 2009 demand levels.
The biggest gainer this year will be the category of hydroelectric power and all other renewable energy sources. Demand for this group of energy sources will grow to 8 quads, up just 2.9% from last year, and meet 8.3% of US energy needs.
Increased use of wind, hydroelectric power generation, and biofuels is driving demand for renewables, such that last year the group of energy sources posted 4% demand growth.
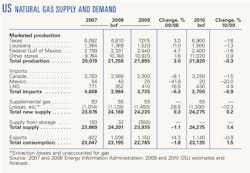
Natural gas demand in 2010 will climb 1.5% to 23.71 quads, based on increased use in power generation and some strengthening in industrial demand. Gas will account for 24.7% of the energy market this year.
Last year, gas demand shrank 1.8% on a decline in demand by industrial users as well as by residential and commercial customers. Electric power generators consumed slightly more gas during 2009 than during 2008.
Coal demand will fall another 2% this year after last year's 10% contraction in light of low gas prices. The use of coal moved lower across all types of its consumers but was down most sharply among industrial users and electric power generators.
Dominating the energy market with a 37.5% share, oil demand will climb 1% this year following last year's 4.5% decline. Most oil products will be in greater demand compared with last year's weak levels. Motor gasoline demand registered a small uptick, but all other products saw a decline in demand in 2009.
OGJ expects that nuclear energy demand will be unchanged in 2010 at 8.46 quads, as the number of operable units in the US holds at 104—the same number since 1998. Demand for nuclear energy barely increased last year from a total of 8.455 quads in 2008.
US oil supply
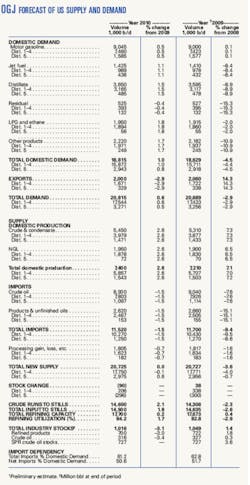
US oil production will continue to rebound from its recent low in 2008, when crude and condensate output averaged 4.95 million b/d. OGJ forecasts that oil production in 2010 will average 5.45 million b/d, up from 5.31 million b/d last year.
During 2009, there were no major disruptions to production, such as hurricanes in the Gulf of Mexico. This is in sharp contrast to 2008, when two major storms caused average US oil production to sink below 4 million b/d in the month of September of that year.
Alaskan oil production slid last year to average an estimated 648,000 b/d, down from the 2008 average of 683,000 b/d. In its December 2009 Short-Term Energy Outlook, EIA forecasts that Alaskan oil production this year will fall to average 590,000 b/d.
In 2009, average oil production increased in a few states, including Louisiana, North Dakota, Texas, and Oklahoma. Average production in Louisiana jumped to an estimated 1.41 million b/d last year from a 2008 average of 1.153 million b/d. In North Dakota, oil production climbed to an estimated 210,000 b/d last year from 172,000 b/d a year earlier.
NGL production will climb to average 1.95 million b/d, up from 1.9 million b/d in 2009 and 1.784 million b/d in 2008.
Imports, exports
In 2010, US imports will slide, although not as sharply as they did last year. OGJ forecasts that the US will import 8.9 million b/d of crude in 2010, excluding any for the Strategic Petroleum Reserve. This will be a 1.5% decrease, following a 7.6% decline in crude imports last year.
US imports of petroleum products also will fall by 1.5% this year to average 2.62 million b/d, following last year's 15.1% decline on extremely weak demand for products and plentiful volumes in storage.
Last year, the source of the most US crude and products imports was Canada, with average volume of 2.228 million b/d. Mexico, which exported 1.266 million b/d of crude and products to the US last year, was followed by Venezuela, Saudi Arabia, Nigeria, and Russia.
Of all products, residual fuel oil was imported the most last year with an average of 350,000 b/d. Distillate and motor gasoline imports trailed imports of resid, followed by propane and jet fuel imports.
The US will export 2 million b/d of oil this year, mostly as products. In 2009, US oil exports averaged 2.06 million b/d, up from 1.8 million b/d a year earlier.
Inventories
With product demand gaining steam and refinery utilization still suppressed, stocks of crude and oil products will diminish during 2010.
Crude oil in storage, excluding that in the SPR, will fall to 316 million bbl at the close of 2010. This is down from a yearend 2009 total of 327 million bbl, which was 1 million bbl higher than a year earlier.
The total volume of oil products in storage also will move lower from the end of 2009. OGJ forecasts that product stocks will total 700 million bbl at the end of this year, down from the year-earlier total of 722 million bbl.
Volumes of motor gasoline, jet fuel, and distillate in storage were plentiful during 2009, even as imports and refinery utilization rates were weak, due to feeble demand.
The amount of crude in the SPR will remain at its physical capacity of 727 million bbl at the end of 2010. Last year, the reserve grew to this level from 702 million bbl. The Department of Energy took advantage of lower oil prices in the first half of the year.
Also last year, repayments to the SPR were made for supply released to refiners in the wake of hurricanes in 2008, and the SPR took delivery of royalty-in-kind oil during 2009.
Refining
Recovering product demand will cause average US refinery utilization in 2010 to pick up a bit from 2009, climbing to 84.2%.
Operable capacity will increase only slightly this year to 17.7 million b/d from 17.673 million b/d, slowing the trend of incremental annual capacity growth. Meanwhile, total inputs to refineries will rebound from the 2009 average of 14.6 million b/d to average 14.9 million b/d.
Gross inputs to US refineries plunged in the fourth quarter of 2009 on weak demand. Total inputs for the 4 weeks ending Nov. 27, 2009, averaged 14.1 million b/d, which was down about 1 million b/d from a year earlier.
Refinery utilization averaged an estimated 82.8% last year. Early maintenance pushed down utilization to average 81.5% in February 2009 vs. 85% in February 2008. The utilization rate peaked last year for the month of June, averaging 86.1%. During the final month of 2009, refinery utilization averaged just above 80%, according to EIA figures.
Amid the weakness in product demand, prices remained low even as crude prices on the world market regained strength late last year. With the economy in recession, refiners were unable to pass on their high crude prices to their customers.
The refiners' acquisition cost of domestic and imported crude in November 2009 averaged $76.85/bbl, according to EIA. That month, the Gulf Coast cash operating refining margin sank to average just 6¢/bbl, according to Muse, Stancil & Co. (MSC). The highest monthly average last year was for January, when this margin averaged $6.67/bbl.
US East Coast cash margins fared worse than the Gulf Coast margin, averaging a negative $1.10/bbl in March 2009 and only about $1.50/bbl for the year, according to MSC.
Oil products
Demand for all major oil products except resid will increase this year. Total domestic demand for products will average 18.815 million b/d, rebounding from 2009, but still down from the 2008 average of 19.5 million b/d.
Product demand growth in 2010 will be sluggish along with growth of the US economy. As long as unemployment remains high, demand for transportation fuels will have limited upside potential. Transportation fuel demand last year sagged on declines in commercial trucking, business travel, and leisure travel.
Motor gasoline demand will average 9.045 million b/d this year, up just 0.5%. Last year demand for gasoline was little changed from a year earlier at 9 million b/d.
Gasoline prices last year dipped to average $2.35/gal after peaking in 2008 with an annual average pump price for unleaded gasoline of $3.26/gal.
OGJ forecasts that a small increase in business travel this year will boost average jet fuel demand to 1.425 million b/d. Down 8% from a year earlier to 1.41 million b/d, jet fuel demand in 2009 hit its lowest annual average since 1993.
Demand for distillate fuel oil will move up 1.5% this year to average 3.65 million b/d, not as high as its 2008 average of 3.945 million b/d. Distillate demand fell 9% last year is spite of much lower prices.
Demand for distillate by industrial users declined the sharpest last year, while use among residential, commercial, and electric power customers was little changed from a year earlier. Most distillate demand is for ultralow-sulfur diesel and used for transportation, while the remaining demand is for heating oil.
Residual fuel oil demand will dip to average 525,000 b/d from last year's 527,000 b/d. Resid, which is mostly used in electric power generation, has experienced declining demand in favor of gas since the early 1980s. Demand for resid declined 15% last year.
Demand for liquefied petroleum gases will rebound nearly to their 2008 level, averaging 1.95 million b/d this year. In 2009, demand for LPG fell 2% as a result of dismal construction activity and petrochemical demand.
Natural gas
US gas demand will climb 1.5% this year as a result of colder winter weather and an increase in gas use for power generation. Gas consumption by industrial users sank last year and will see limited growth in 2010.
OGJ forecasts that gas production will sink marginally this year to 21.82 tcf. Marketed production of gas in the US last year jumped 3% from a year earlier to 21.895 tcf. This 2009 increase was due to a recovery in output following 2008 hurricane activity and to a boost in production from shale-gas plays.
Louisiana's gas output surged 11% last year, but will sink by 1.3% this year. Gas production in Texas and in the federal Gulf of Mexico will decline 1.6% in 2010, following last year's increased production.
US imports of gas will move lower again this year, but by a much smaller margin than the 2009 drop. A hike in imports of LNG was unable to overcome a loss of imports from Canada and Mexico last year, such that total imports fell to 3.735 tcf from a total of 3.984 tcf a year earlier.
OGJ forecasts that LNG imports will climb again this year by almost 5% to total 430 bcf, but that gas imports from Canada and Mexico will decline again, for a total decline in imports of almost 1%.
Because of the uptick in domestic demand, the US will export 1.14 tcf of gas in 2010, slightly less than a year ago. During 2009, gas exports surged 14% due to plentiful supplies in storage and slumping demand.
The amount of gas in storage will be unchanged from the end of 2009. Last year, the amount of working gas in storage grew 300 bcf on weakened demand and increased production. Storage levels throughout 2009 stayed above their 2008 totals, and after the first quarter of 2009, the amount of gas in storage stayed at the top of the recent 5-year range.
The wellhead price of gas last year sank to average an estimated $3.70/Mcf, compared with $8.07/Mcf a year earlier. And the average delivered commercial price of gas last year declined 21% from 2008 to average $9.45/Mcf.
More Oil & Gas Journal Current Issue Articles
More Oil & Gas Journal Archives Issue Articles
View Oil and Gas Articles on PennEnergy.com


