OGJ FOCUS: CO2 PIPELINES—1: Study details methods for determining steady-state pressure, temperature
Determining steady-state pressure and temperature profiles of new CO2 pipeline systems requires both accurate routines for predicting fluid properties and reliable methods of calculating, based on these properties, related pressure and temperature changes along the pipeline route. Key properties include density, kinematic viscosity, specific (isobaric) heat capacity, Joule-Thomson coefficient, and isentropic change of temperature with pressure.
The capture of CO2 from power plants, its transportation through pipeline systems, and its long-term deposition in suitable storage reservoirs both on and offshore is considered a feasible option for preventing CO2 from entering the atmosphere, mitigating adverse anthropogenic greenhouse gas effects.
The first part of this series, presented here, will describe in detail methods for determining steady-state pressure and temperature profiles incorporating all of these CO2 stream properties. The conclusion, presented next week, will address the expected influence of impurities present in real CO2 streams on the hydraulic pipeline layout and present an overview diagram enabling a first estimation of the most economic pipeline diameter, depending on intended CO2 throughput rates.
Fig. 1 shows a basic scheme for CO2 capture, pipeline transportation, and storage options.
Background
Fig. 2 shows a phase diagram of pure CO2 in the pressure range up to 200 bar. The phase above the critical pressure and the critical temperature is the supercritical phase, while the dense phase refers to operations in either the supercritical or liquid states.1 2 During transitions between gas phase and supercritical phase as well as between the latter area and liquid phase, the local properties of CO2 change gradually, Fig. 2's lines separating defined areas of each phase.
If the pressure is less than the critical pressure, however, an abrupt phase transition occurs between gas and liquid as the vapor pressure line is crossed. Gas and liquid phases in this case can coexist at the same pressure on the vapor pressure line. Heat is then required to evaporate liquid phase CO2, or it will be released during condensation from gaseous to liquid CO2.
This article uses phase diagrams with color-coded physical properties of pure CO2 in the pressure range 25-175 bar and temperature range from 0-50° C. to illustrate the hydraulic pipeline layout. These properties were determined using of high-precision calculation routines.3 4
Physical properties considered include:
• Density as the dominant property required for determining pressure changes in the pipeline due to friction losses and elevation changes.
• Kinematic viscosity determining flow regime inside the pipe directly influencing the friction loss factor.
• Specific heat capacity describing degree of temperature change when heat is added or removed from the fluid, e.g., by heat exchange with the surrounding environment.
• Partial derivative of temperature with pressure at constant enthalpy (Joule-Thomson coefficient) allowing estimates of the fluid temperature decrease due to friction effects.
• Partial derivative of temperature with pressure at constant entropy allowing estimates of fluid temperature changes due to compression or expansion resulting from elevation changes along the pipeline.
All figures demonstrate the relatively smooth change of relevant properties between the fluid phases when pressure and temperature are changed, provided the vapor pressure line is not crossed.
New onshore pipeline
Fig. 3 shows that in the range 100-125 bar and 10-40° C. CO2 maintains a density between about 629 kg/cu m and 939 kg/cu m, corresponding roughly to the density of light- to-heavy regularly transported hydrocarbon liquids. Temperature's influence is high. At a pressure of 100 bar, density increases from about 629 kg/cu m to about 920 kg/cu m when the temperature drops from 40° C. to 10° C., a relative density increase of about 46%.
Fig. 4 shows in the same pressure and temperature ranges, the kinematic viscosity of CO2 lies between about 0.076 sq mm/sec and 0.109 sq mm/sec: much smaller than the kinematic viscosity of liquids such as water (roughly 1.0 sq mm/sec at 20° C.) or propane (~0.2 sq mm/sec at 20° C.) CO2's kinematic viscosity under these conditions is also much smaller than that of gases such as air at low pressures (~16 sq mm/sec at 1 bar, 25° C.) but approaches that of higher pressure gasses (air at ~0.17 sq mm/sec at 100 bar, 25° C.).5
Fig. 5 shows in the range 100-125 bar and 10-40° C. the specific (isobaric) heat capacity of CO2 is about. 2,218-5,657 J/(kg*K). The figure shows a relatively high influence of pressure and temperature on specific heat capacity, with maximum values concentrated in the range above the critical point on the (fictively) extrapolated vapor pressure line. Transporting CO2 at the higher values of specific (isobaric) heat capacity accordingly reduces changes of fluid temperature due to heat transfer with the ambient (e.g., soil) or other thermodynamic influences (friction losses, elevation changes).
The Joule-Thomson coefficient is the partial derivative of the temperature with pressure at constant enthalpy as (∂T/∂p)h. It describes, for a steady-state-operated horizontal pipeline, the hypothetical specific temperature change expected as a result of pressure reduction due to friction, assuming no heat exchange with the environment occurs.
Fig. 6 shows the Joule-Thomson coefficient of CO2 in the range 100-125 bar and 10-40° C. as between about 0.027 K/bar and 0.266 K/bar, considerably smaller than the Joule-Thomson coefficient of natural gas in high-pressure natural gas transmission pipelines (~0.4 K/bar at 75 bar and 20° C. for methane).
A Joule-Thomson coefficient ~0.10 K/bar would mean a fluid temperature decrease of 1 K for every 10-bar pressure loss caused by friction (adiabatic conditions provided).
A fluid moving through pipeline in hilly terrain will be subject to elevation differences resulting in related changes of pressure and density. Estimating the influence of the pressure (and density) changes on the fluid temperature (assuming hereby reversible, adiabatic and steady-state transportation conditions) requires determining the partial derivative of the temperature with pressure at constant entropy (∂T/∂p)s.
Fig. 7 shows the specific isentropic temperature change with pressure as between 0.075 K/bar and 0.294 K/bar for the range 100-125 bar and 10-40° C. The values in this figure represent the ratio of finite pressure and temperature differences between two neighboring points situated on the same isentropic curve.
For 100 bar and 25° C. the specific isentropic temperature change amounts to 0.13 K/bar. An elevation change of ~100 m therefore (resulting in a pressure change of ~8 bar) would produce a temperature change of roughly 1 K. This estimation shows temperature effects caused by elevation changes may become considerable if the pipeline runs through terrain with major elevation changes.
Pressure, temperature profiles
The main considerations to determine the optimum pressure levels and hydraulic profiles of CO2 pipeline systems refer to:
• Avoiding two-phase flow in the pipeline system.
• Meeting the pressure requirements at the pipeline end-wellheads for CO2 stream injection into the storage formation.
• Ensuring CO2 transportation at the most economic conditions.
Ensuring stable and safe transportation conditions along a CO2 pipeline system with only a single CO2 phase requires operating the pipeline such that under no conditions do actual pressure-temperature conditions inside the pipeline system cross the vapor pressure line of CO2. This is always accomplished if the pipeline system is operated above the actual critical pressure of the CO2 stream and hereby sufficient safety distances in pressure can cope with potential deviations between real system behavior and the theoretical design case.
While the critical pressure of pure CO2 is about 73.8 bar, the critical pressure of real CO2 streams from CO2 capture facilities will most likely be higher, depending on type and concentration of impurities.
Operating a pipeline system at dense phase or at supercritical phase conditions is, however, not unusual. Such conditions are common for major natural gas transmission pipelines, which are almost always operated at supercritical conditions, i.e., above the critical pressure (typically 45-50 bar) and above critical temperature (typically –80° to –60° C.).
Pressure required at the injection wellheads to the storage formation is one of the major boundary conditions for overall pipeline system layout, including potential installation of facilities for pressure change at the pipeline end. Injection pressure depends on a series of conditions such as reservoir depth, minimum, original, and maximum reservoir pressures, filling grade, and friction pressure losses in the bore hole. A recent study addressed related aspects.6
The study assumed delivery pressure at injection site of 85 bar with flowing wellhead pressure (FWHP) limited to 160 bar, affected by reservoir-related relationships of injection pressure, hydrostatic pressure, and depths up to 4 km. Installation of injection facilities (boosting) is assumed at the storage site to increase pipeline end-pressure to wellhead pressure. Since the last quantities of CO2 injected are the most costly and consume the most energy, the optimum degree of filling should be investigated in a related feasibility study addressing safety and economy.
The study also notes that high-rate CO2 injection in a depleted gas field has not been done anywhere in the world and refers to two recent related studies which estimated injection flow rate/well at a relatively broad range of 0.2-1.25 million tons/year.6
At the start of the injection phase (initial state), reservoir pressure can measure below 35 bar with CO2 still in the gaseous state. This requires reducing delivery pressure at pipeline end to injection pressure at the wellhead site. A heater station might also need to be installed upstream of pressure reduction to prevent freezing of residual water, formation of hydrates, and potential reservoir damage by thermal stress.
After prefilling the gas field at a moderate rate, the injection rate can accelerate to the desired plateau injection level, prompting an increase in wellhead pressure at the wellhead site.
Accommodating CO2 production (in the capture plant) and CO2 injection (to storage) at minimized cost requires a detailed storage development plan, including adequate scheduling of the various injection points within a storage cluster.
Design pressure and pipeline diameter directly influence the investment costs of new CO2 pipeline systems via the WT. Optimum selection of pipeline diameter, maximum design-operating pressure, and number-location of intermediate transport stations for a given throughput scenario and elevation profile yields a minimum specific cost/ton CO2.
The following aspects will particularly influence steady-state operation pressure of a new pipeline system for CO2 transport:
• Two-phase flow in the pipeline system must be avoided by appropriate selection of minimum pressure, also considering the influence of impurities.
• An elevation profile with major elevation differences (e.g., a mountainous or considerably descending route) will lead to higher operating-design pressures in specific pipeline sections and at the pipeline end point.
• Longer CO2 pipeline systems. Suitable selection of number and position of intermediate transfer stations can reduce maximum operating-design pressure.
• Offshore pipeline systems may require higher WT not only to meet stability criteria for pipelaying, but also to cope with higher operating pressures that might be required if intermediate transport station(s) or an injection station at the storage site cannot be installed due to technical or economic considerations (e.g., unavailability of platforms to install equipment for a pressure increase).
Reaching a good prediction accuracy for calculation purposes requires subdividing the whole route length into a suitable number of sections for which pressure and temperature variations are then determined individually based on local pressure and temperature-dependent CO2 properties. Discussion will consider only a single-phase operated pipeline system, especially in the dense phase.
Equation 1 allows calculating the friction pressure losss of CO2 behaving with low viscosity as a Newtonian liquid. Equation 2 determines the Reynolds number.
The flow regime will be turbulent for all relevant pipeline diameters, flow velocities, and viscosities for CO2 transportation. The Colebrook-White equation (Equation 3) can iteratively determine the friction coefficient, λ.7
Friction factors λ will equal 0.010-0.016 for 12-40 in. OD, flow velocities of 0.5-2.0 m/sec, pressures of 80-150 bar, temperatures of 0-40° C. and pipe roughness values of 0.025-0.1 mm.
Equation 4 defines the pressure change inside a pipeline section caused by elevation difference between inlet and outlet.
Equation 5 shows the usual calculation approach for determining the outlet temperature of a pipeline section,7 with Equation 6 defining constant and Equation 7 estimating length-related heat transfer coefficient, k.
Low-compressible fluids (like water or oil) transported at moderate velocities inside a pipeline system allow temperature T∞ in Equation 5 to be attributed to the temperature of the material surrounding the pipeline, e.g. for a buried pipeline where T∞ represents the thermally undisturbed soil temperature at the depth of the pipe axis.
CO2, as a compressible fluid with considerable pressure-temperature influence on density, requires consideration of friction pressure losses (Joule-Thomson effect) and major elevation differences (isentropic compression-expansion) on the outlet temperature of a pipeline section.
Equation 8 extends the known approach8 considering the Joule-Thomson effect by influence of elevation changes with respect to both influences, with Equation 9 showing the length-related temperature change coefficient j due to the Joule-Thomson effect and Equation 10 the length-related temperature modification coefficient i due to elevation changes.
Constant α according to Equation 6 allows formulation of Equation 8 as Equation 11.
Rearranging and integrating between temperatures T1 and T2 (Equation 12) yields Equation 13 and finally Equations 14 and 15.
This result is also in line with the approach shown in literature when the elevation's influence on temperature is added analogously to the friction influence (OGJ, Feb. 26, 1979, p. 107).
Hypothetical pipeline
Specific CO2 emissions from a pulverized coal power plant with post-combustion CO2 capture technology would presumably amount to about 0.81 kg CO2/kw,9 with a related 1,000-Mw power plant producing 810 tons/hr of CO2.
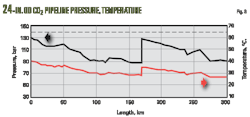
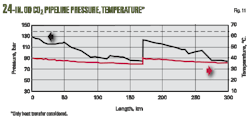
Figs. 8-10 show typical hydraulic profiles of pressure, temperature, density, elevation, velocity, and the friction coefficient of a hypothetical 24-in. OD land-based CO2 pipeline system, designed to transport 1,200 tons/hr of CO2 over a distance of 300 km. Pipeline inlet conditions measured 130 bar and 40° C. After about 170 km a booster station increases pipeline pressure. Pipeline design pressure for determining WT measured 140 bar, with soil conductivity 1.0 W/(m*K).
Pressure variations in Fig. 8 reflect pressure differences caused by the geodetic head differences along the hypothetical elevation profile.
Investigating the influence of friction loss and elevation differences on calculated pressure and temperature profiles (Figs. 11-13) requires determining hydraulic profiles with different combinations of Joule-Thomson coefficient and isentropic pressure-temperature (p-T) effects due to elevation changes (Equation 10).
The hypothetical elevation profile leads to the conclusion that (in addition to heat exchange and specific fluid heat capacity) at least the friction influence on the temperature profile (via Joule-Thomson effect) should be included in predicting pressure and temperature along the pipeline route. Further improvement of prediction accuracy, especially for local temperature conditions, is possible if temperature variations caused by pressure modifications due to elevation changes along the pipeline route are also considered.
After capture, the CO2 stream has to be brought into the initial CO2 compressor station from the (relatively low) outlet pressure of the capture plant to the inlet pressure of the pipeline. A multistage compression process with four to eight compression stages including interstage coolers would conventionally perform this process. Installed separators prevent ingress of potentially condensed water into the next compression stages.
Other potential compression strategies include using cryogenic liquefaction and pressure increase via pumps to raise CO2 pressure to the injection pressure level.10 11
Economic reasons will require longer CO2 pipelines be built of carbon steel. Protecting the CO2 pipeline from wet CO2 corrosion will require integrating a CO2 drying process, most likely into the initial compression station but depending on water concentration at the station inlet. The dehydration process can be a glycol absorption process operating at an intermediate pressure level.
Fig. 14 shows the typical configuration of an initial compressor station. The driver arrangement is shown schematically. Compressors may be coupled individually or commonly to the driver(s). The driver(s) may be steam turbines, gas turbines, electric motors, or even gas motors for small applications.
Fig. 15 shows the variations of pressure and temperature within the hypothetical CO2 transportation system.
Assuming the CO2 stream to be compressed is fed at 1.0 bar and 30° C. to the suction side of the injection compressor station, compression occurs in a seven-stage process to reach the required station outlet pressure of 130 bar. Coolers installed downstream of each compression stage reduce temperature to the defined 40° C. Stages 1-6 operate in gas phase, while Stage 7 compresses the CO2 from about 65 bar to roughly 130 bar where the phase is supercritical or dense. After cooling once again to about 40° C., the CO2 enters the pipeline.
Fig. 15 also shows variations of CO2 pressure and temperature along the pipeline, with pressure always remaining above critical (~73.8 bar). The fluid state therefore changes between supercritical and liquid, but the transitions are smooth and no abrupt phase transition occurs, the vapor pressure line remaining uncrossed during transportation.
References
1. Eldevik, F., et al., Det Norske Veritas (DNV): "Development of a Guideline for Safe, Reliable and Cost Efficient Transmission of CO2 in Pipelines," Elsevier, Energy Procedia 1, pp. 1,579-1,585, 2009.
2. Eldevik, F. et al., Det Norske Veritas (DNV): "Safe Pipeline Transmission of CO2," Pipeline and Gas Journal, Vol. 235, No. 11, November 2008.
3. Overhoff, U., and Wagner, W., "Software FLUIDCAL, Lehrstuhl für Thermodynamik," Ruhr-Universität Bochum, 2005.
4. Span, R., and Wagner, W., "A New Equation of State for Carbon Dioxide Covering the Fluid Region from the Triple-Point Temperature to 1,100 K at Pressures up to 800 MPa," Journal of Physical and Chemical Reference Data, Vol. 25 (1996), No. 6, pp. 1,509-96.
5. VDI-Warmeatlas, Berechnungsblätter für den Warmeubergang, 5. Auflage, 1988.
6. "Potential for CO2 Storage in depleted gas fields on the Dutch Continental Shelf, Phase 1: Technical assessment," NOGEPA Report No. 2008-U-R0674/A, June 2008.
7. Heyen, B., and Lohner, H., "Auslegung von Erdgastransportsystemen—Einfluss der Variation von Auslegungsparametern auf die Genauigkeit der Simulationsergebnisse," gwf Gas—Erdgas, Vol. 141 (2001), No. 11, pp. 791-803.
8. Mohitpour, M., et al., "Pipeline Design & Construction, A practical Approach," 3rd Ed., pp. 107-111, New York: ASME, 2007.
9. Ecofys/TNO Study, "Global Carbon Dioxide Storage Potential and Costs," EEP-02001, Table 5, 2004.
10. Moore, J.J., et al., "Novel Concepts for the Compression of Large Volumes of Carbon Dioxide, Final Report," Southwest Research Institute, Sept. 28, 2007.
11. Jarosch, J., "Improving Efficiency of Compressing CO2 for Re-Injection," seminar proceedings, Institute of Mechanical Engineers, Carbon Capture and Storage, London, Oct. 28-29, 2009.
The author
More Oil & Gas Journal Current Issue Articles
More Oil & Gas Journal Archives Issue Articles
View Oil and Gas Articles on PennEnergy.com


