Special Report: LNG Update: US gas market well-supplied: LNG or shale gas?
Expanding natural gas production from indigenous sources poses the most serious threat to imports of natural gas as LNG into North America, primarily the US. For North America, increased natural gas production is only likely from unconventional plays, mainly shale gas.
Since 1999, net US proved natural gas reserves have increased every year. Since 2006 this is largely attributable to the growth in shale-gas discovery and development.
There are at least 24 substantial shale-gas reservoirs in North America with recoverable reserves in the US alone estimated to be as much as 824 tcf. Some reports say shale gas can be produced economically at wellhead prices ranging $3.50-7.50/MMbtu. The variation is primarily a function of reservoir characteristics.
Estimated US shale-gas production grew to 6.5 bcfd in 2009 from 800 Mcfd in 1998. The growth in US proved natural gas reserves is based on currently economically recoverable reserves.
The growth exceeds ongoing production volumes, suggesting lower future demand for imported natural gas, mainly LNG. In addition, the ongoing global economic decline beginning in 2008 has reduced natural gas consumption, further reducing demand.
Growth of unconventional
So-called conventional natural gas reserves have steadily declined for many years. Since 1998 natural gas production from unconventional sources has increased to 8.9 tcf/year in 2007 from 5.4 tcf/year. Unconventional natural gas reserves include coalbed methane and "tight gas" from sandstone and carbonate formations. Coalbed methane is the least expensive to produce of the unconventional sources of natural gas but is only a fraction of unconventional reserves. Tight-gas reserves are projected to be as much as 60% of the available US unconventional resources.
Shale gas is a large portion of the tight-gas reserves, and production has been increasing rapidly as technology has developed since 2004. The initial breakthrough in shale-gas production was stimulated by water-fracturing completion techniques and then boosted with application of horizontal drilling.
Shale formations serve as the source and the reservoir for natural gas. Shale is a sedimentary rock consisting of clay and silt-sized particles consolidated with simultaneously deposited organic materials. The deposits are compacted by subsequent additional sedimentary deposits into thinly layered shale rock. The layers have limited horizontal permeability and extremely low vertical permeability. Ultimate hydrocarbon recovery is about 20% of initial gas in place.
Horizontal drilling has been in use for a long time in development of conventional hydrocarbon production sources. The deposition process of shale rocks makes using horizontal drilling particularly attractive.
Horizontal drilling is especially effective for reservoirs that exist largely in the horizontal plane. A horizontal well may penetrate 2,000-6,000 ft or more of a formation, while a vertical well will only expose the thickness dimension of the reservoir. Far more vertical wells are needed to achieve the same level of producible reservoir formation.
Horizontal drilling reduces the number of wells, thus reducing the impact on the surface environment. A typical shale-gas development will require six to eight wells/sq mile, while at least 16 vertical wells would be required for the same potential production rate. In addition to simply having fewer wellsites, the horizontal well development will require fewer access roads, pipeline routes, and production facilities.
Shale-gas hydraulic fracturing uses primarily water with sand to act as a proppant with 2% or less chemical enhancers. Average water consumption is about 4.5 million gal/well. The minimum regulatory requirements for hydraulic fracturing are still under debate at both state and federal levels. It appears certain that well development using significant hydraulic fracturing will only be approved with a drilling plan that protects existing and future subsurface and surface water production reservoirs and streams.
The composition of hydraulic fluids will probably have to be reported before use in order to obtain governmental approvals. A full disposal plan and, perhaps, cleanup programs for the recovered hydraulic fracturing fluids will ultimately probably have to be provided for review and approval before proceeding with the project. The primary impact on the project is extended timing for approvals with associated increased costs.
Shale-gas potential
Shale-gas production activity is occurring in many places but the primary current production is in Texas from the Barnett formation near Fort Worth, Arkansas from the Fayetteville formation, Louisiana from the Haynesville formation, the Marcellus formation in Pennsylvania, New York, Ohio, and West Virginia, and the Antrim formation in Michigan.
Chesapeake Energy has been one of the most active companies pursuing US shale gas. This Nomac Drilling LLC rig is working in the Fayetteville shale. Nomac is a wholly owned affiliate of Chesapeake. (Photo from Chesapeake)
Barnett shale production is expected to reach 3.5-4 bcfd by yearend 2011. Total US shale-gas production was estimated to be near 6.5 bcfd at yearend 2009. Canada also has very large shale-gas potential in British Columbia in addition to already producing coalbed methane projects.
Shale-gas production technology is on a steep development curve and further improvements will certainly enhance the economics of shale gas. Fig. 1 shows the typical shale-gas well production profile.
Initial production levels range from 1.5 MMscfd to as much as about 8 MMscfd with a few wells showing levels of more than 20 MMscfd. The decline curve varies greatly from well to well. Most developers expect wells to maintain average production of about 1.5-3 MMscfd for 4-6 years with an estimated ultimate recovery on the order of 3.5-5 bcf/well.
Drilling costs are clearly a function of formation depth, surface conditions, and formation impacts on horizontal drilling techniques. Projects in the Barnett development report combined drilling and completion costs ranging $3-5 million/well. Projects in the Marcellus generally report combined costs of $1.5-4.3 million/well with some operators indicating as much as $7 million/well. Projects in the Woodford of Oklahoma are reporting costs of $7-8 million/well with extended horizontal laterals of 6,000-7,000 ft.
Clearly the shale-gas industry has huge potential but currently also has many uncertainties that remain to be resolved. The industry is in its infancy, however, having only become commercial in the last 10 years. Some projects report the ability to produce shale gas economically at prices as low as $2-3/MMbtu. Given the uncertainties that prevail in industry reports, this seems to be overly optimistic as a general industry benchmark.
Following review of industry data available in the public domain, we developed an economic model to understand the primary uncertainties and associated minimum market pricing necessary for the shale-gas industry to grow. The model reflects the ability to vary the land acquisition costs—reported from $1,000 to $4,000/acre. The model includes inputs for drilling and completion costs, local infrastructure such as access roads and utilities, and gathering system flowline costs.
The model includes a cost for a 300-mile connecting pipeline and has input costs for cleanup of hydraulic fluids both for facilities and ongoing operations. The model can vary estimated ultimate recovery per well and well spacing.
It appears that a sale price into a major trunkline of $7/MMbtu will provide a 15% internal rate of return with the following assumptions:
• Drilling and completion costs/well $5 million.
• Average production rate 3.7 MMscfd/well.
• Land acquisition costs $1,200/acre.
• Well spacing of 100 acres/well.
• Operating costs $3/MMbtu.
The analysis includes financing costs at 4.5%.
Naturally the model is sensitive to average production rates, operating costs, and drilling costs. To achieve a 15% IRR at a gas sales price of $5/MMbtu requires reducing drilling costs to $4 million and increasing average production to 5 MMscfd. Alternatively, reducing drilling costs to $4 million, decreasing operating costs to $2/MMbtu, and increasing the average production rate to about 4 MMscfd also achieves 15% IRR at $5/MMbtu.
This analysis would suggest that shale gas can be expected to enter the market place in large volumes with a sales price in the $5-7/MMbtu range given further improvement in technology and operating techniques.
LNG competition
The global LNG industry has experienced significant growth in new plants and expansions of existing plants 1996-2009. It appears to be pausing before committing to further major expansions to consider whether the global economy will support such major additional capital investment.
At this point, LNG production capacity exceeds volumes currently committed to long-term sales and purchase agreements that have provided the financing basis for the industry. Excess volumes can be exported to essentially any global market as a result of the concurrent surplus LNG shipping capacity, although not all trades would yield economically attractive results.
Markets with the ability to receive and consume additional LNG are primarily Europe, the US, India, China, Korea, and Japan. Japan and Korea are essentially fully supplied by their long-term sales and purchase agreements and have little appetite for additional LNG at current market pricing.
Excess production capacity with the ability to serve remaining markets is in the Middle East, North Africa, West Africa, and the Caribbean. Shipping distances from production facilities to the markets range from about 2,000 nautical miles (Trinidad to the US) to nearly 10,000 nautical miles (Qatar to the US). The other potential trades fall at varying distances in between.
US natural gas pricing is very complex and will not be discussed here. As has already been implied, the US can quickly bring large additional natural gas production from unconventional sources into the market should it become economically attractive. This requires US natural gas marketplace pricing of $5-7/MMbtu, given a minimum acceptable IRR of 15% for the producers.
As of Mar. 1, the US had nine LNG import terminals operating with direct pipeline access into the pipeline grid. Commissioning was under way on another offshore terminal, GDF Suez's Neptune in Massachusetts Bay; construction was nearing completion at ExxonMobil's Golden Pass terminal in Texas along Sabine Pass.
Canada's Canaport in New Brunswick and Sempra Energy's Costa Azul in Mexico's Baja California target most or some of their volumes for US markets.
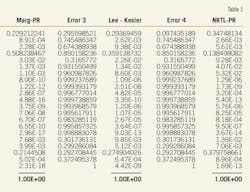
Table 1 shows most US LNG import terminals and their physical characteristics.
US LNG import terminals are largely underutilized, having the capacity to import nearly their full sendout capacities. This would suggest the ability to import four-five 155,000-cu m LNG carriers/day, equivalent to 15 bcfd of regasified LNG.
Alternatively this volume is equivalent to about 100 million tonnes/year of LNG production capacity, nearly 50% of the global LNG production capacity at yearend 2009. Due to already committed long-term LNG sales and purchase agreements, the estimated actual maximum LNG available to the US market is about 5 bcfd (Table 2).
That table shows that US natural gas production in 2009 was a little more than 21 tcf, including 6-7 tcf of shale-gas production.
LNG sales prices are established by the long-term LNG sales and purchase agreements, which have varying links to global oil pricing. LNG producers do not wish to endanger the pricing of long-term contracts and would prefer to sell their excess capacity at pricing higher than those contracts. Due to the industry's current excess production capacity at least for the short term, that is not possible—certainly not for all producers.
Only one major LNG producing plant—Indonesia's Arun plant—has been shutdown since it was originally constructed and that was a function of running out of feed gas. The remainder of the plants include two constructed in the 1960s, many built in the 1970s, and the balance constructed since. Of the five major projects listed in Table 2, one started up in 1999, two in the early 2000s, and two in the late 2000s.
The newest plant—QatarGas/Ras Gas—is the largest and holds a competitive advantage due to its lower unit cost as a function of the economies of scale that it enjoys. The oldest plants in this list have operated reliably with high availability since they initially began operation–their original financing should be largely paid off.
Norway's Snohvit plant incurred major cost overruns and had performance problems during initial operation—this remains an incentive for the operator to sell all the LNG it can to recover those losses. In general, all LNG plants have demonstrated extremely high reliability and availability that supports their ability to provide LNG to baseload demands.
Model, costs
We have constructed an economic model that reflects the individual LNG production plant characteristics if it is shipping production into the US. We have assumed offloading at Trunkline's Lake Charles, La., terminal only for the sake of consistency; the product could be unloaded at nearly any of the terminals listed in Table 1. Table 3 shows a range of LNG sales prices that could be achieved by the various LNG projects in Table 1 against a range of cost-recovery scenarios.
Scenario 1 reflects an LNG sales-price range of $3.43-6.45/MMbtu against an economic recovery model that includes the full LNG chain: feed-gas production, LNG plant, shipping, and import terminal with an economic performance of 15% IRR.
Scenario 2 is the same but shows a LNG sales price of $2.71-5.13/MMbtu for a 10% IRR. In other words the LNG project would be accepting a lower profit level.
Scenario 3 shows an LNG sales price range of $2.71-5.83/MMbtu necessary to achieve an IRR of 15% but not including the LNG import terminal costs in the chain.
Scenario 4 is the same as the third but shows an LNG price range of $2.13-4.65/MMbtu for a 10% IRR.
Scenarios 1, 2, 3, and 4 are all based on recovering the full initial capital cost for each of the LNG chain components although to varying levels of economic performance.
Scenario 5 is the full LNG chain except for the LNG import terminal but does include a throughput charge as if the import terminal were acting as a tolling facility to provide storage and regasification to the LNG chain. This shows an LNG sales price range of $2.83-5.94/MMbtu while achieving an IRR of 15%.
Scenario 6 is the same as Scenario 5 but assumes that only 50% of the initial capital investment is to be recovered, i.e., a significant portion of the project's capital expenditures are already paid off and the project is willing to recover the current marginal return. This shows an LNG price range of $2.63-3.26/MMbtu while achieving an IRR of 15% against the remaining loan. The projects that have not recovered at least 50% of their original investment would be making the decision that a partial return was better than nothing.
Scenario 7 is the same as Scenario 6 but assumes that only 10% of the initial capital investment is to be recovered by this trade. This shows an LNG price range of $1.09-2.28/MMbtu while achieving an IRR of 15% against the remaining loan. The projects that have not recovered their original investments would be making the decision that a partial return was better than nothing.
Table 3 shows that the LNG producers could choose to send LNG to the US at almost any level of natural gas market pricing and they would be able to make at least some level of profit at minimum prices of about $2.50-3.25/MMbtu. At US natural gas market prices of $2.85-6.00/MMbtu, they would be able to achieve up to their full minimum profit levels (assumed at 15% IRR).
Fig. 2 shows the results of Table 3 graphically. It also indicates that the longer the shipping distance for the trade, the higher the LNG sales price must be to achieve the same level of economic return.
Implications
Shale gas or low demand-driven US market prices of $5-7/MMbtu will not keep LNG out of the US, but only potentially reduce the profit levels of some LNG producers. Clearly shale-gas production levels could greatly exceed the realistic levels of LNG imports to the US.
At very low US demand levels (probably as a function of declining economic conditions), however, LNG could still continue to come into the US marketplace and greatly diminish shale-gas production.
LNG producers will continue to select trades that maximize their profitability. US gas producers, however, should not anticipate that LNG will not come into the US marketplace due to shale-gas or other unconventional competition.
The same sales price but shorter shipping distance, higher sales price and the same shipping distance, small "loss-leader" sales to protect larger and more profitable long term sales—all these continue to attract LNG to other markets. But there is no inherent wall to keep LNG out of the US if it is the last resort for making a profit.
The author
More Oil & Gas Journal Current Issue Articles
More Oil & Gas Journal Archives Issue Articles
View Oil and Gas Articles on PennEnergy.com
