Applying scheduling software to the design stages of a complex multiproduct pipeline helps make the finished line safer, more reliable, and more economic. Such software allows verification and modification of preliminary design to ensure the full functionality of the final plans, including pump selection, before construction.
The long distance, large diameter, multiple delivery points, and variable hydraulic states of China’s planned Lan-Zheng-Chang multiproduct pipeline complicate the process of pump selection.
Designers based delivery plans and dimensions of the LZCPP on expected 2015 market demand for products along the pipeline, using scheduling software to verify pump configuration. Using the scheduling software in design exposed irrationalities in pump selection, prompting adjustments.
Background
China University of Petroleum–Beijing developed scheduling software used in design of LZCPP. Operators can schedule virtual shipments on the software platform by inputting profile data of the pipeline (diameter, distance, wall thickness, etc.), properties of the products, the pipeline’s initial line pack, the transportation plan, and flow rates at the line’s point of origin. The software also uses start time, delivery flow rate, and volume at all delivering stations to draw a delivery plan.
LZCPP represents the first use of the software in a design application, although it has been successfully applied to operating a number of multiproduct pipelines in China, including the Lan-Cheng-Yu pipeline,1 2 the Lu-Wan pipeline, the Gang-Zao pipeline, the South-West pipeline,3 and the Western pipeline.
CUPB developers designed the software so that operators already familiar with it in a scheduling context would easily be able to use it in a design context as well. Simple pipeline technology is easy to schedule, and pump units selected during preliminary design adapt well to actual operation. Schedulers can use Excel or many other software options to complete their tasks.
The hydraulic state of a pipeline with multiple input and delivery points, however, is far harder to manage and requires more advanced tools to address. Proper design of such pipelines also requires use of these tools to avoid expensive retrofitting of pump stations. CUPB’s software improves multiproduct pipeline design and increases the efficiency of both construction and operation.
CUPB software provides functionality not provided by other simulators, allowing scheduling of virtual shipments rather than simply modeling dynamic flow. It guarantees a transport schedule before construction and determining the actual hydraulic conditions of the line, improving design efficiency and reducing the need for post-construction corrections.
LZCPP
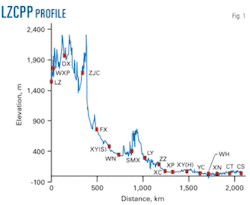
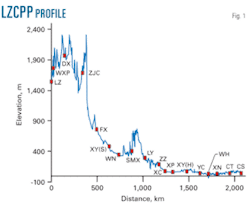
The 2,148.4-km LZCPP consists of one origination station, five delivery points, eight combination delivery-pumping stations, one injection station, and one terminal station (Fig. 1). The pipeline’s OD starts at 610 mm before growing to 660 mm and subsequently shrinking to 508 mm. Designed operating pressure of the trunk line is 8-10 MPa. It is longer, wider, and has more delivery points and hydraulic states than most products pipelines.
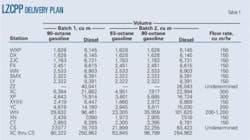
LZCPP’s planned Batch 1 consists of 90-octane gasoline and diesel, while Batch 2 is 93-octane gasoline, 90-octane gasoline and diesel.
Table 1 shows LZCPP’s cyclic delivery plan, derived from annual product market demand and annual refinery capacity. Table 2 shows the injection schedules for LZ, XY(S), and ZZ stations.
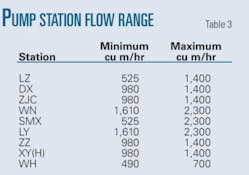
Initial pump unit data and configuration allow calculation of each pumping station’s maximum discharge flow rate based on experimental data under specific conditions. The conventional minimum discharge flow rate is 70% of a given pump’s rated flow rate. Table 3 shows flow ranges for each pump station, including delivery pump stations.
Applying the software to the design process generates potential pump schedules of complexity beyond what is required for the project.
Transport schedule
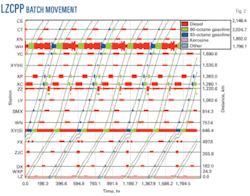
Designers input these primary design data into the software to generate the scheduling shown in Fig. 2
The abscissa in Fig. 2 refers to time and vertical axis distance. The names of all delivery stations, injecting station, and originating station run down the left of the diagram, while the positions of these stations are on the right. The short bold bars represent the process of delivering and injecting. The oblique lines represent the trajectory of the contamination segment between two adjacent products.
Initial problems
While developing the transport schedule, designers found that the pump units in ZZ station and XY(S) station needed adjustment to avoid creating delivery bottlenecks.
- ZZ station. ZZ station both delivers and injects products. The station’s discharge flow rate equals the sum of the upstream flow rate and injection rate. Discharge flow rates must be constant to ensure the stable hydraulic operation of the pipeline.
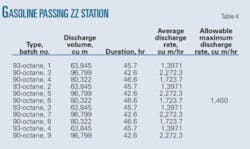
Small upstream gasoline batches pass ZZ station quickly but are too small to meet downstream demand, requiring that the flow rate leaving ZZ be increased. Downstream demand for each gasoline batch and the rate at which gasoline passes ZZ allow calculation of the station’s average discharge rate (Table 4).
Table 4 shows an average discharge flow rate for 90-octane gasoline greater than ZZ’s maximum discharge flow rate of 1,400 cu m/hr. Failure to modify the pump configuration will require construction of floating-roof tankage to allow downstream demand for 90-octane gasoline to be met; such tanks allowing diesel to be discharged and stored while additional gasoline is input. The right lateral shift of the oblique lines in Fig. 3 at the batch interface of 90-octane gas and diesel shows the presence of the floating-roof tank at ZZ.
- XY(S) station. The duration of 93-octane gasoline passing XY(S) station is very short and the injection pumping capacity used in preliminary design is small, requiring flow upstream of the station be stopped to allow completion of injection. This interruption may increase contamination costs due to the great topographic difference between FX and XY(S) stations (Fig. 1).4 5 Limited injection pumping capacity also requires establishing a storage operation similar to that at ZZ station, for use when 90-octane gasoline passes the station.
Design improvement
Scheduling analysis allowed designers to adjust the initial design. They first reevaluated their choice of pump units, increasing capacity at ZZ station, avoiding the need to build new floating top storage facilities, and decreasing the overall storage volume of the station.
They also decided to upgrade the injection pumps at XY(S) station, increasing that station’s input to the pipeline and producing the same net storage benefits as those found at ZZ station.
These pump unit adjustments satisfied the variable hydraulic state of the pipeline and met its design requirements.
Acknowledgment
The authors acknowledge the engineers of China Petroleum Pipeline Engineering Corp. and various pipeline companies for their suggestions.
References
The authors
Li Ming ([email protected]) is a PhD candidate at Beijing Key Laboratory of Urban Oil and Gas Distribution Technology, department of oil and gas storage and transportation, China University of Petroleum [prior education to He earned his BS in oil and gas storage and transportation from LiaoNing University of Petroleum & Chemical Technology (2004).
Gong Jing ([email protected]) is a professor at China University of Petroleum. She also serves as deputy dean of petroleum engineering at the university, concentrating on transportation technology of long distance pipelines and theory and technology of multiphase flow and oil and gas gathering. She earned her PhD in oil and gas storage and transportation from China University of Petroleum-Beijing (1995).
Liang Yongtu (liangyt21st@
163.com) is an associate professor at China University of Petroleum-Beijing, where he is also pursuing his PhD in long-distance pipeline transportation. In 2005, he spent 6 months at Robert Gordon University in Aberdeen as a visiting scholar. His multiproduct pipeline simulation and stripping scheduling software are used by several products pipelines in China. Liang earned his MS (2001) and BS (1995) from China University of Petroleum-Beijing.
Li An ([email protected]) is an engineer at China Petroleum Pipeline Engineering Corp. He earned his BS in oil and gas storage and transportation from CUPB (2000)
