OIL SHALE—3: Analytic approach estimates oil shale development economics
An analytical approach estimates that the minimum economic price for developing the vast US oil shale resources to be $38-62/bbl of shale oil produced. If prices go back to $60/bbl, the model indicates good economic feasibility for an oil shale industry.
Rapidly advancing conversion technologies, high oil prices, rising world demand for liquid hydrocarbons, and continued decline of US conventional oil production have all recently attracted significant attention to development of the oil shale resource. Additionally, development of this resource could benefit local, state, and national economies by means of revenues, royalties, contributions to the gross domestic product, value of avoided oil imports, and a possible shale oil production rate of about 2.4 million b/d.
This article, the third of four, describes the economics for developing US oil shale resources. Parts 1 and 2 covered the resource base (OGJ, Jan. 19, 2009, p. 56) and production technologies (OGJ, Jan. 26, 2009, p. 44) .
The concluding article in a future issue will discuss the environmental effects of developing oil shale.
Analytical approach
The US Department of Energy (DOE) has developed the national strategic unconventional resources model that is an analytical system for evaluating potential US oil shale development under different economic and public policy regimes.1
The model can perform sensitivity analyses relative to price, tax, royalty, and incentives; perform cash-flow analyses under alternative leasing options; and evaluate costs and benefits of various public policy options to stimulate oil shale project investment. The model has three detailed modules for evaluating the resource, screening the technology, and providing detailed economics.
The resource module contains detailed petrophysical and geological characterestics for 25 development tracts in Colorado, Utah, and Wyoming. These tracts collectively contain in place a 70 billion bbl resource.
Detailed studies of these 25 tracts were part of the 1973 US Department of Interior prototype oil shale leasing program. Because of previous industry nomination, this article assumes that these tracts represent locations of commercial interests. These nominated tracts, therefore, provide a solid technical basis for the present analysis.
The analysis developed screening criteria for various technologies based on the geological characteristics such as depth, dip angle, yield, and thickness of the resource.
The technologies considered are:
- Surface mining with surface retorting.
- Underground mining and surface retorting.
- Modified in situ (MIS).
- True in situ (TIS).
The analysis screened each of these 25 tracts for all technology options, assigned the most appropriate technology to each tract, and evaluated each tract under the specific process. Each tract had an assigned specific development schedule based on the type of technology applied.
The economic module uses production forecasts for each tract (based on its development schedule) for cash-flow analysis. The economic model estimates annual and cumulative cash flow before and after taxes, capital costs, operating cost, transfer payments (royalties), revenues, and profits.
The analysis then carries forward the tracts that meet the economic hurdles and aggregates the results for all remaining tracts.
The economic model uses average capital and operating costs based on the technology and development schedule during a project’s life. The model considered the different technologies used for mining, retorting, and upgrading in the components of the costs.
Project costs
Oil shale projects, on a commercial scale, could range from 10,000 to 100,000 b/d for a surface retort to as much as 300,000 b/d for full-scale in situ projects. The capital and operating costs will depend on the process technology and the quality of the resource.
The model estimated operating costs of $12-20/bbl of shale oil produced. Estimated capital costs range from $40,000 to $55,000/stream day bbl of daily capacity.2 These costs also include mining (or drilling), retorting, and upgrading costs.
These costs pertain to operational first-generation projects and will change with time as technologies mature.
Minimum economic price
The minimum economic price is the world crude oil price needed to yield a 15% rate of return (ROR) on the project. The 15% ROR covers the capital cost and the project’s technical and financial risk. The minimum economic price for oil shale projects depends on the technology used and the quality of the resource.
Under the assumptions used, for a mature 100,000 b/d capacity plant, the model estimates that the average minimum economic price is $38/bbl for true in situ, $47/bbl for surface mining, $57/bbl for underground mining, and $62/bbl for modified in situ (Fig. 1).2 These estimates are sensitive to both technological and economic assumptions, but discussions with industry have indicated that these estimates are reasonable.
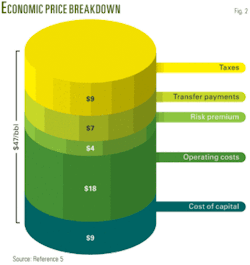
The minimum economic price includes several components in addition to the 15% ROR and capital and operating costs. As Fig. 2 shows, a portion of the cost relates to taxes and transfer payments including royalties. The effect of taxes on a project’s cash flow will determine whether the project is economically viable.
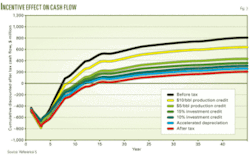
Fig. 3 displays the effects of tax credits and other incentives that the oil shale industry may receive to stimulate investment.3
Potential shale oil production
Three scenarios show the production potential of the 25 tracts (70 billion bbl of resource in place). These scenarios are:
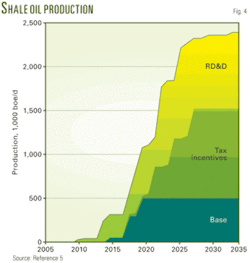
- The business-as-usual (BAU) scenario assumes no changes to current law and that future oil prices remain in the range of high $40s-60/bbl as predicted by the US Energy Information Administration (EIA) in its 2006 Annual Energy Outlook (reference price track).4
- The tax incentive scenario assumes targeted tax incentives are available until project payback to encourage investments. Examples are price guarantees and production tax credits.
- The research, development, and demonstration (RD&D) scenario assumes limited public support for RD&D and field demonstration projects at commercially viable scale to reduce project risk.5
Fig. 5 displays the results of the three different scenarios. Under the BAU scenario, shale oil production could reach 500,000 b/d by 2020 and would remain steady through 2035.
With targeted tax incentives, shale oil production could reach 1.5 million b/d by 2035.
Risk reduction through RD&D could have a positive effect on future shale oil development in the US. RD&D projects would accelerate the rate of oil shale development. With successful RD&D, the analysis estimates that the oil shale production could reach 2.4 million b/d by 2035.
Because oil shale project development requires long lead times, none of the three scenarios expects much production until 2015.6
In addition to shale oil, the projects could also produce much hydrocarbon gas. Gas production varies as a percentage of total production depending on the surface retorting or in situ technology; however, gas production could reach 3.2 bcfd.
The oil shale projects could consume much of the produced gas for process heat, power generation, or other process requirements. Alternatively, if upgraded to pipeline quality, the gas could contribute to meeting regional and national natural gas demands.1
Macroeconomic benefits
Development of an oil shale industry provides potential public benefits. Federal, state, and local governments and the overall domestic economy will benefit from direct contributions of a domestic oil shale industry and from additional economic activity and growth that will result from industry development. Direct benefits include:
- Direct federal revenues from federal taxes and federal share of royalties.
- Direct state and local revenues from state and local taxes plus the state share of federal royalties.
- The value of avoided oil imports.
- Employment.
- Contribution to gross domestic product (GDP).
Federal, state revenues
Based on the BAU scenario, direct federal revenues could reach $0.9 billion/year by 2035. With the incentives introduced in the RD&D scenario, federal revenues could reach $4.2 billion/year at the end of the 30-year period analyzed.1
Direct state revenues generated by the BAU scenario are $0.6 billion/year in 2035. In the RD&D scenario, state revenues could reach $2.9 billion/year by 2035.1
Total public sector revenues (the sum of direct federal and state revenues) could reach $1.5 billion/year for the BAU case and $7.0 billion/year for the RD&D scenario by 2035. Cumulative public sector revenues through 2035 could total $24.6 billion for the BAU scenario and $85.6 billion for the RD&D scenario.1
Imports avoided
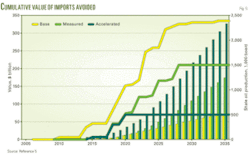
The BAU scenario production of shale oil would replace about $4.1 billion/year of imported oil by 2035. The RD&D scenario would save the US $22.4 billion/year by 2035 that would have otherwise been spent on imports.
Cumulative imports avoided through 2035 are $72 billion for the BAU scenario and $325 billion for the RD&D scenario (Fig. 5).1
Employment
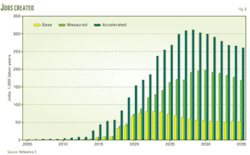
Oil shale industry development will add thousands of new, high-value, long-term jobs in construction, manufacturing, mining, production, and refining. These estimates are based on industry expenditures as well as jobs created in the petroleum sector.
Not all direct employment will be jobs new to the economy. Some will be filled by workers shifting from one sector to another. The jobs will not all be in states with oil shale development sites. Other states that design or manufacture trucks, engines, steel, mining equipment, pumps, tubular goods, process controls, and other elements of the physical complex will also share in the jobs creation.
The RD&D scenario for oil shale development will create nearly 250,000 new jobs by 2035. The BAU scenario employment is less (Fig. 6).1
GDP contribution
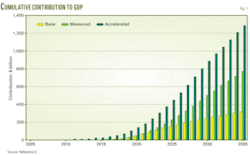
These projects will contribute directly to the economy, as measured by the gross domestic product (GDP). The analysis estimates an annual contribution of $76.6 billion by 2035 for the RD&D scenario.
The cumulative contribution to GDP for the BAU scenario is $313.9 billion. The cumulative direct GDP contribution for the RD&D scenario is $1.2 trillion through the year 2035 (Fig. 7).1
Economic analysis limitations
The economic analysis presented has several assumptions. Particularly, it is difficult to project all associated costs and benefits because there is no commercial production of oil shale in the US.
The national strategic unconventional resources model instruction manual, p. 38 (www.unconventionalfuels.org), lists the limitations, which include:
- The results pertain only to the 25 federal tracts analyzed. The analysis made no attempt to extrapolate the results to all oil shale resources in Colorado, Utah, and Wyoming. Also, the analysis assumes that these tracts are accessible for development.
- The analysis assumes that current technologies will be viable at commercial scale during the next 5-10 years. If not, the development of the resource will be impeded.
- Another assumption is that the environmental permitting process for the oil shale projects could be completed within 3-5 years. The timing of oil shale production will be affected if the permitting process is not streamlined and additional time is required.
- The analysis uses EIA’s 2006 oil price projection (reference price track) during the next 25 years. Different prevailing oil prices will affect the estimated benefits. Moreover, the BAU case analysis assumes operators obtain an average minimum 15% ROR. To the extent that some operators may require different returns on their investments, the analysis may over or under estimate potential benefits.
- The economics scenarios use average costing algorithms. Although developed from the best available data and explicitly adjusted for variations in energy costs, the algorithms do not reflect site-specific cost variations for specific operators. To the extent that the average costs under or over state true project costs, the actual results will be affected accordingly.
- The estimates of potential contribution to GDP, values of imports avoided, and employment do not take into account potential effects to other sectors of the US economy from altering trade patterns. It is possible that reduced petroleum imports, depending on where the petroleum was coming from, could reduce the quantity of other goods being exported. It is likely, however, that such effects would be small.
- The analysis assumes that operators have access to capital to start and sustain the oil shale projects. Oil shale projects are capital intensive and have longer payback period relative to other oil and gas development projects. To the extent that capital is constrained, this analysis over states the potential benefit.
None of these limitations, however, invalidates the results in this analysis if one views them for their intended purpose, which is to estimate an upside potential. Given the uncertainty of the size and combinations of the optimistic and pessimistic biases introduced by these limitations, it is assumed that the approach is valid, and the estimates are reasonable.
References
- National Strategic Unconventional Resources Model, US Department of Energy, Office of Petroleum Reserves, Office of Naval Petroleum and Oil Shale Reserves, April 2006.
- Biglarbigi, K., “Oil Shale Development Economics,” EFI Heavy Resources Conference, Edmonton, May 16, 2007.
- Biglarbigi, K., “Potential Development of United States Oil Shale Resources,” EIA Energy Outlook Conference, Washington, DC, Mar. 28, 2007.
- Annual Energy Outlook 2006, US Department of Energy, Energy Information Administration, February 2006.
- Biglarbigi, K., et al., “Economics of Oil Shale Development in the United States,” Paper No. 11650, SPE ATCE, Denver, Sept. 21-24, 2008.
- Biglarbigi, K., et.al., “Potential for Oil Shale Development in the United States,” SPE Paper No. 110590, SPE ATCE, Anaheim, Nov. 11-14, 2007.
The authors
Marshall Carolus ([email protected]) is an associate with Intek Inc. His work involves data mining, statistical analysis, and the development and application of oil and gas models to evaluate the oil and gas resource potential, recovery, and energy economics. Carolus was involved in the development of the national oil shale model and currently is involved in the update of the economic and cost data for the model. Carolus has a BS in mathematics from Villanova University.
The biographies and photos of Khosrow Biglarbigi, Hitesh Mohan, and James Killen appeared in Part 1 of this series (OGJ, Jan. 19, 2009, p. 56).


