Upgrade optimizes Weyburn tank vapor recovery, pressure relief
An upgrade of the Weyburn tank battery vapor-recovery system eliminated the problem of the tank pressure and vacuum relief valves (PVRVs) venting to the atmosphere.
The work involved running a simulation that used the Peng Robinson Sour (PRS) equation of state to match the production tank vented flows. Once the simulation obtained the match, the next step entered the maximum expected future tank vented flows into a process simulation.
The maximum PRS simulated flows provided the basis for sizing the equipment for the upgrade.
Weyburn battery
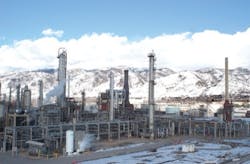
EnCana Corp.'s Weyburn Saskatchewan oil battery reinjects dense-phase CO2 for enhancing oil recovery. The battery separates produced gas from the oil and then compresses the gas for recycling it back into the reservoir together with CO2 obtained from the Great Plains Synfuels Plant, in Beulah, ND.
Because the associated and produced gas contains H2S and CO2, storage of the oil and water requires a closed system that includes:
• Two 10,000-bbl and one 33,000-bbl custom built water tanks.
• Two 10,000-bbl oil tanks.
• One 5,000-bbl slop tank.
Weyburn reinjects the produced water for reservoir pressure maintenance. The oil enters a pipeline to a custody-transfer sales point.
Because CO2-EOR has increased oil and associated water production, associated gas from the oil and water tanks also has increased.
CO2 is very soluble in water; hence water contributes 72% of the tank vented gas, while produced oil accounts for the remaining 28%.
Existing facilities
Before the upgrade, an NPS 10-in. gathering line collected the vapors from all tanks. The vapors went either to the vapor-recovery compressor or above a certain pressure via a pressure control valve (PV-8500) to flare.
If the gathering line's pressure exceeded the relief pressure of the tanks, the PVRV vented the vapor to the atmosphere. The lowest set pressure is at the large water tank with a set PVRV pressure of 3 kPa-g or 7 oz/sq in.
Table 1 summarizes key data for the production and slop tanks and Fig. 1 shows the six tanks.
Fig. 2 shows a simplified diagram of the flow. At the start of this study, EnCana had scheduled some equipment for decommissioning, such as the VRU (K-302) and the gas boot (V-1705).
The existing K-1700 VRU (rated at 1.3-2.5 MMscfd at simulation conditions) could handle the existing flows. When the VRU flow rates reach 2.5 MMscfd, the plan was to install a second twin VRU.
Tables 2 and 3 show the material balance calculations for Streams 4, 17, 20, 23, 28, and 35 indicated in Fig. 2. Table 2 is for flow before the upgrade, and Table 3 is for the flow for the maximum flow rates for designing the vapor-handling equipment.
The battery has three inlet separators: a high-pressure gas separator (V-701) and two free-water knockouts (V-501 and T-340). The two free-water knockouts feed the four treaters (H-201 to 204) and most of the water to the produced water tanks.
The high-pressure gas separator feeds the recycle compression (not shown or included in the PFD material balance).
The diagram represents the oil treaters as a heater (FT2) and a separator (H-204). These units make up one complete treater. The treaters feed the gas boot V-1705 and the produced water tanks T-5, 8, and 9.
The gas boot (V-1705) feeds the oil tanks (liquid) and the K-302 VRU.
The produced oil, swing, and slop tanks (T-6, 7, and 10) feed the K-1700 VRU.
The produced water tanks (T-8 and 9) feed the K-1700 VRU (vapor) and the water injection pumps (liquid).
Gathering lines collect the vapor off the tanks and feed it to the VRU preferentially. If the VRU becomes overloaded, the excess vapor goes to flare via a pressure control valve PV-8500. The last line-of-defense is the PVRVs on the top of the tanks that relieve vapor to the atmosphere.
The vapor-handling equipment operates as follows (Fig. 3):
• For controlling overpressure if the VRU cannot keep up, at 2.0 kPa-g PV-8500 opens and directs gas to the low-pressure flare. If pressure exceeds 3.0 kPa-g, the tank PVRVs vent to atmosphere.
• In the case of under pressure if the VRU pressure drops below 1.5 kPa-g, the VRU recycle valve opens and the VRU discharge recycles to suction for balancing inlet flow deficiency. If pressure drops below 1.0 kPa-g, the tank PCVs open and feed fuel gas to adjust pressure. The last-line-of-defense is the PVRVs that allow air into the tanks below –0.18 kPa-g.
Process design
The objective of the process design was to debottleneck the tank's vapor-handling equipment. The steps involved were:
1. Build a model of the Weyburn battery and vapor-handling unit. Note, the Oil & Gas Journal article (Nov. 16, 2006, p. 43) gave the composition of the oil and gas for the restaged compression and new pump installation.
2. Compare actual operating conditions (Tables 4 and 5), mainly the flow to the VRU, with the battery model in Step 1.
3. Match the battery model with the actual operating tank vented flow. Table 6 compares the K-1700 VRU actual flow vs. the simulations for different streams.
4. Determine if the existing flow (Stream 35, June 6, 2008, material balance = 64,600 cu m/day) does not exceed the capacity of running only the K-1700 VRU (capacity: 34,000 cu m/day (1.2 MMscfd) to 70,800 cu m/day (2.5 MMscfd)). If it does not exceed capacity (64,600 cu m/day), shut down the K-302 VRU and gas boot.
5. Feed the maximum expected flows to the battery model. From this simulation, obtain the maximum flow to be handled by the vapor-handling equipment.
6. Design the gathering line size, PV-8500, VRU capacity, and flare for the maximum flows found in Step 5. Proceed with the detailed design, construction of the new vapor-handling unit after review and EnCana approval.
Operating condition match
The simulation required installation of a meter on the discharge of K-1700 VRU. The meter provided data for matching actual flow rate with the simulation runs for three rates and conditions that may affect the results.
Table 4 summarizes the operating water, oil, and gas flows for the non-CO2 flood reservoir vs. the CO2 flood reservoirs and Table 5 provides the plant operating conditions for the simulations.
The simulations used these production flow rates and battery operating conditions for evaluating all potential flows off the tank vents. The three cases run were:
1. All gas to battery with 82% CO2 (current CO2 gas content vs. 92% in 10 years).
2. Only the 200,000 cu m/day of gas to the battery, specified as 5.5% CO2 (gas produced from non-CO2 injected reservoir).
3. All gas to battery with 92% CO2.
Simulation results
Table 6 shows the flow summary of simulation for Streams 28 and 35, respectively.
Stream 28 is the discharge of the K-1700 VRU. This flow corresponds to the flow through the newly installed flowmeter (FQIT-1709) that we tried to match and compare. Stream 35 is the total flow vented off all the production and slop tanks. Hence, these streams are the flow rates that all of the existing tank vapor-handling equipment must handle after the removal of the gas boot and K-302 VRU.
Table 7 compares the flows in each case.
From Table 7, we can conclude that the simulations were conservative. For the actual match Case 2, the simulation predicted 6% more gas than read by FQIT-1709 or the actual maximum-recorded flow.
The simulation for maximum flows involved extrapolating Case 1 (using 83% CO2 gas analysis). Using this case ensures a 12% conservative number vs. 25% by using Case 3.
The maximum expected flow rates at the Weyburn battery in the maximum simulation are:
• 8.49 million cu m/d (300 MMscfd) associated and produced gas-83% CO2.
• 6,000 cu m/day (37,740 b/d) oil production.
• 40,000 cu m/day (251,600 b/d) produced water.
• 12,000 cu m/d (75,480 b/d) source water.
From the simulations run for the maximum case, the total produced vent gas (Stream 35) is 89,600 cu m/day (3.2 MMscfd).
From the flow comparison of Table 7, we can normalize the flows to predict the maximum normalized flow.
It now follows that the vent flow predicted when the CO2 in the reservoir is 92% (in 10-15 years) will be 1.075 × 89.6 = 96,600 cu m/day (3.4 MMscfd).
The evaluation included the creation and running of a model of the vapor-handling equipment pressure drops (Fig. 3).
The new flare pressure-drop simulations evaluated the maximum throughput through the VRU and flare. Fig. 3 shows the results of the maximum flow rate through the piping network.
The original pressure drop for the flow of 89,600 cu m/day provided a final pressure of 1 kPa-g at the flare tip and 1.48 kPa-g at the VRU K-1700. For sensitivity analysis, the simulation also included a run with a flow rate through the flare header and stack of 108,000 cu m/day (+10%). This resulted in a final flare-tip pressure of 0.76 kPa-g.
The FKOD and flare will see intermittently higher flow rates because the operation requires the addition of fuel gas for enhancing the heat content of the process gas to 6-8 MJ/cu m when the CO2 content is greater than 87%. The fuel gas is added at the inlet to the FKOD.
At 92%, a maximum of 10-20% fuel gas must be added to get to 6-8 MJ/cu m. Hence for 96,600 cu m/day, the process would need an additional 10,000-20,000 cu m/day. The highest flow through the FKOD and flare will be 98,000-116,000 cu m/day (4.1 MMscfd).
Equipment process design
The main items required for the low-pressure vent system included vent-gas piping, FKOD, flare stack, VRU, flare-gas pressure control valve PV-8500, and flare fuel-gas makeup valve to adjust blended gas to 6 MJ/cu m.
The design sized the vent-gas piping per the maximum tank vent-gas flows predicted by the simulations. The evaluation simplified the simulations conservatively to flow the total tank vent gas from the farthest water or oil tank. The water tank vent would start at Tank No. 5, through the NPS 14-in. line off the top flange, and through the NPS 16-in. line to the junction of oil tank Nos. 6 and 7.
The oil tank vent would start at Tank No. 6 NPS 10-in. top flange line and join the NPS 10-in. common oil-vent header. The water tank vent gas and the oil tank vent gas join at the NPS-10-in. oil tank gas vent and the NPS 16-in. main header. Tank No. 10 is a rework tank and produces insignificant vapors.
The gas in the combined NPS 16-in. vent header can go now to the VRU if the pressure is less than 2 kPa-g or to the flare knockout and ultimately to the flare if the pressure is more than 2 kPa-g.
When the heat content of the process vent gas drops to less than 6 MJ/cu m, the process requires the addition of fuel gas so that the gas has the minimum 6-8 MJ/cu m required for complete combustion in the John Zink flare. The piping does not have to handle the added fuel gas. The flare knockout and flare can handle the added 14,200-28,300 cu m/day of additional gas.
The evaluation sized the flare knockout drum, designed by Falcon, at 1.83 m diameter by 3.05 m with NPS 16-in. inlet and outlet connections. The design includes heating and instrumentation for control of pumping out liquids.
The flare stack was a John Zink 50-ft, self-supported, Rimfire, high CO2, high-destruction efficiency unit.
The existing VRU is a Fuller Kovalko CC-300 compressor capable of 1.2-2.47 MMscfd with 1.6 SG gas at atmospheric pressure suction and 400 kPa-a discharge. It could operate until it gets fully loaded. After that, EnCana will twin this unit to have ample capacity to compress the 3.2 MMscfd at maximum flows.
The flare-gas pressure control valve PV-8500 is a Fisher V-ball NPS 12-in. for handling 100,000 cu m/day (3.5 MMscfd) at 2 kPa-g.
The flare fuel-gas makeup valve to adjust blended gas to 6-MJ/cu m (FYV-1043) is an NPS 2-in. Fisher 657-40 D body for flow of 5,700-28,320 cu m/day (0.2 to 1 MMscfd).
Cost, schedule
The project stopped and started several times for incorporating a separate project to build tank access to the top of all the tanks and to avoid winter construction. EnCana justified the project economics as required for debottlenecking the flare and header to avoid atmospheric tank venting.
Table 9 shows the projects costs.
The construction costs were 59% (they usually are 50%) of the total costs because of the difficulties with construction. The tank construction delays were due to:
• Interruptions of the work at the tank site for frequent tank venting through PVRVs. This affected both civil and piping work.
• The need to empty, neutralize, and isolate each tank during the tie in.
• Conducting the work with both flares operating simultaneously to avoid a long production shutdown.
• The 30-week delivery of the electrical switchgear and transformer. This delayed electrical piping interfaces such as heat tracing.
• Expensive demolition of existing flare and ancillaries, which required intermittent work.
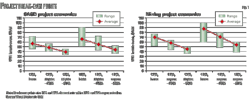
Fig. 4 shows the project schedule. Note that the project was put on hold from December 2007 to Apr. 1, 2008, to avoid winter construction. The strategy worked relatively well because construction was during mostly warm weather. Unfortunately, the intricacy of interfacing the civil and piping work with the operating problems made simple tasks take double the time.
Engineering, construction
The project required extensive civil mechanical drawings, as follows:
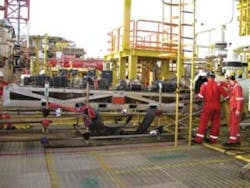
• Foundation drawings for the pipe rack, FKOD, flare, and tank platforms. Fig. 5 shows a specific platform view of the several platform installations required on the six tanks. The platform gives complete access to the top of the tanks.
• Piping drawings including piping and instrumentation diagrams, plot plans, materials isometrics, and 3D new piping and tank detail.
• FKOD skid layout of equipment and bill of materials.
The construction involved:
• Installation of a gas-assist type flare stack.
• Skidded flare knockout drum (FKOD).
• New flare header line (16-in. NPS).
• Replacement vent lines off the tank, vent nozzles on the tank roof with an upsized vent header running to the existing VRU compressors.
• New fuel-gas header line with individual tie-off piping runs supporting the new low-pressure flare.
• New drain line from the new FKOD to the tanks.
• Demolition, removal of the existing old low-pressure flare stack, buried low-pressure FKOD, buried portion of the low-pressure flare header line, and low-pressure vent header lines off the tanks.
Additional work included isolation, cleanout, and proper in-place abandonment of any ancillaries, removal of the vent header running to the existing VRU and compressors, and removing the utility portion of the low-pressure flare line.
Pipe stress analysis
Fig. 6 shows the deformation of the installed piping after the flow was in steady-state operation at 50-60° C. temperature change.
It is critical not to overstress the system. The tank nozzles on the tank roof provide an example. These nozzles are between NPS 10 and 12 in.
The roof membrane is 3⁄16-in. WT. The nozzles cannot tolerate any significant moments because they would easily deform or fail the roof membrane. It took considerable effort to minimize the moments with guides and anchors.
Electrical design, construction
The electrical drawings consisted mainly of controlling the FKOD liquid level. The turning on and off the pump would control a certain level.
A second component of the design was electric tracing all the vent lines and FKOD shell to keep them from freezing.
The last component included the design of gas detection, ventilation, and lighting.
Prewiring all electrical and instrumentation lines into locally mounted junction boxes simplified construction. Thus the majority of field electrical and instrumentation work was installation of cables and conduits from junction boxes to master control centers and programmable logic control panels. Electric heat tracing was installed in the same fashion.
Results
The VRU meter readings were within 6% (lower) of values predicted in the simulations. This implies that the Peng Robinson Sour equations have enough accuracy for predicting CO2 recycle gas behavior in oil and water.
The simulations with the maximum flow rates accurately predicted the tank vented flows to the VRU. Thus, the sizing of the tank vent piping and associated handling equipment is reliable.
By twinning of the existing VRU K-1700, the two VRUs can easily handle the maximum predicted flow rates of 109,000 cu m/day. One VRU can handle 2.0-2.5 MMscfd or 57,000-71,000 cu m/day. This value is from a data sheet for a Fuller Kovalko CC-300 VRU.
EnCana operations reported that after installation of the low-pressure flare system, they did not encounter any problems with overpressure or flow surges in the VRU or flare.
Acknowledgment
The author expresses his thanks to EnCana's lead operations engineer Gerry May, who was the project manager for the upgrading work.
The author
More Oil & Gas Journal Current Issue Articles
More Oil & Gas Journal Archives Issue Articles
View Oil and Gas Articles on PennEnergy.com
