US energy demand this year will shrink along with the economy, but total use of all forms of energy will decline by a smaller margin than during 2008.
Oil demand will contract for the second year in a row in 2009, but natural gas demand will increase. Economic weakness will be the biggest factor affecting demand for oil and gas in the US.
Coal demand will see a small decline from a year ago, nuclear energy demand will be unchanged, and the use of energy from renewable sources will post a small increase.
In 2008, strong worldwide oil demand growth coupled with limited spare oil production capacity to push crude and product prices to record levels.
Then, stung by high prices and collapsing economic conditions, oil demand shrunk and caused inventories to swell in the second half of 2008, lowering prices to the start of 2009.
The duration of price weakness hinges on the speed of economic recovery.
Worldwide oil demand
Global oil demand will contract this year by 400,000 b/d, as a 600,000 b/d decline in the countries of the Organization for Economic Cooperation and Development offsets a collective increase in oil demand among non-OECD countries.
In 2008, worldwide demand for oil declined to average 85.8 million b/d from 86 million b/d a year earlier, according to the International Energy Agency. This change also was marked by a large decline in the OECD and a 1.4 million b/d increase in the non-OECD countries, led by rapid demand growth in China, Latin America, and the Middle East.
But this year non-OECD oil demand growth will slow under the weight of global economic contraction. Oil demand in China will climb to average 8.1 million b/d from 7.9 million b/d last year. In 2007, China’s oil demand averaged 7.5 million b/d.
Demand in other non-OECD Asia, the former Soviet Union, the Middle East, and Africa will be unchanged from 2008 while demand in non-OECD Europe declines marginally. Latin American demand will inch up to 6 million b/d this year.
Global oil production
Worldwide supplies of oil are also set to contract this year, provided that pledged output cuts by the Organization of Petroleum Exporting Countries hold.
OPEC in December agreed to reduce its crude output by 2.2 million b/d, in addition to another 2 million b/d in cuts agreed to at meetings the organization held in September and October amid rapidly declining oil demand and even faster-declining oil prices.
OECD oil supply for 2009 is forecast to decline about 500,000 b/d in OECD European countries, hold steady in North America, and increase to 700,000 b/d from 600,000 b/d in the OECD Pacific countries.
Meanwhile, IEA expects that increases in oil production in Latin America and the former Soviet Union will propel non-OECD supplies to average 28.2 million b/d this year, up from 27.6 million b/d a year ago. The Paris-based agency’s outlook also calls for small increases in output in China, other non-OECD Asia, and Africa, and a small production decline in non-OPEC Middle East output.
Adding processing gains and other biofuels to these estimates for 2009 supply, total non-OPEC production will average 50.1 million b/d, up from 49.6 million b/d last year.
OGJ estimates that OPEC output will decline appreciably from last year’s average 32.1 million b/d, as the organization limits supply to ease pressure on full inventories and to bring crude prices back toward $75/bbl.
In keeping with the most recent IEA estimates, these OPEC figures include production in Indonesia, although the country exited the organization at the end of 2008. The agency estimated that Indonesia supplied about 850,000 b/d of oil in the final quarter of last year.
Even with a decline in OPEC output this year, stocks are likely to build. IEA foresees a climb in supplies of biofuels and natural gas liquids, as well as a small increase in processing gains from last year.
If OPEC crude production holds above 29 million b/d and demand and other production estimates prove correct, inventories will climb about 400,000 b/d this year.
US economy, energy
The US economy will remain feeble this year until consumer and investor confidence returns. A strengthening of the financial system and an effective government stimulus plan will be necessary to underpin recovery. OGJ forecasts that GDP will decline 1% this year, erasing all 2008 economic growth.
A string of dismal economic results followed the bursting of the housing bubble last year. Home values plummeted in parts of the US, credit markets froze, stocks slumped, unemployment climbed, and consumer spending shrank on fears that more bad news was looming, creating a downward spiral.
The Bureau of Labor Statistics announced that in December the unemployment rate reached 7.2%, the highest rate in 16 years. In November, the rate was 6.8%, up from 6.6% a month earlier.
BLS also reported that the Consumer Price Index fell in November by 1.9% from the previous month. BLS said falling energy prices, particularly gasoline, drove the decline in the index. Excluding energy prices, the index was virtually unchanged.
Rising unemployment and deflation will weigh on the health of the US economy all year, but some recovery will begin to take hold before 2010.
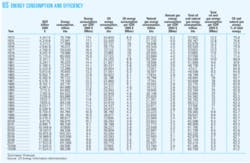
OGJ forecasts that US energy demand will slip 1.4% this year to 98.2 quadrillion btu (quads), building on last year’s gains in energy efficiency.
High oil prices last year forced a decline in demand, which resulted in improved energy efficiency. In the US in 2008, total energy demand fell 2% in spite of a 1% increase in economic output.
Energy sources
While overall US energy use this year will decline, some sources of energy will be in slightly higher demand than they were a year ago. Demand for natural gas, hydroelectric power, and nonhydro renewable energy sources will increase by small margins.
Nuclear energy demand will be unchanged, and the use of coal will slip. Demand for oil will decline by the largest margin of all sources.
Oil demand will fall almost 4% this year, following last year’s nearly 6% contraction under the weight of high prices. Exacerbated by the economic recession, this year’s decline will be spread among all major petroleum products, as was last year’s decline.
Demand for gas will increase on the strength of power demand in an anticipated warm summer cooling season. Driven by low prices, gas demand will climb to 24 quads from 23.78 quads last year.
Combined, the use of oil and gas in the US this year will account for 61.2% of all energy consumed; this is down from last year’s combined 61.6% of energy demand.
The uptick in gas demand will take up some of the slack as coal demand dips 1.1% to 22.55 quads. A year ago coal demand grew to an estimated 22.8 quads from 22.78 quads. Coal will satisfy 23% of US energy demand this year.
The use of nuclear energy in 2009 will remain at last year’s total of 8.4 quads and account for 8.6% of US energy demand. The number of operable nuclear units has held at 104 since 1998.
Demand for renewable energy, including hydroelectric power, solar, wind, and biofuels, will grow to 7.15 quads from 7.1 quads last year.
In 2008, a jump in the use of fuel ethanol and biodiesel propelled demand for renewable energy sources to almost 2% above its level of a year earlier. Hydroelectric power generation and wind electric generation also climbed last year but by smaller margins than ethanol and biodiesel.
US oil supply
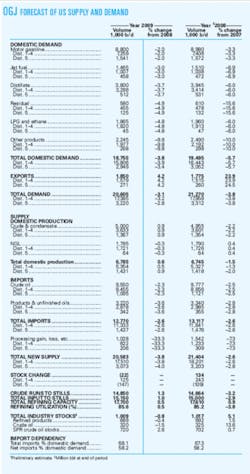
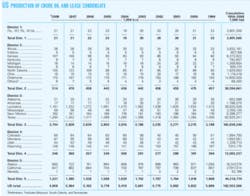
US oil production will gain back some of what it lost last year as a result of hurricanes in the Gulf of Mexico. Crude and condensate production will average 5 million b/d, up 1% after sliding 2.2% last year.
NGL production will average 1.785 million b/d, nearly unchanged from last year’s 1.79 million b/d. In 2007, NGL production averaged 1.783 million b/d.
Oil production this year will get a boost from production in Shenzi, Tahiti, and Thunder Horse fields in the Gulf of Mexico, provided there are no major disruptions brought on by tropical storms.
Meanwhile, low product prices and reduced petrochemical manufacturing will suppress production of NGLs. Poor extraction economics will kill any incentive to produce more NGLs this year.
OGJ estimates that crude and condensate production in Alaska continued its decline to average 683,000 b/d last year, compared with 722,000 b/d a year earlier. The last year production in Alaska moved higher was 2002, when output jumped 2.6% and averaged 988,000 b/d.
States recording production declines last year also included Louisiana, California, Montana, and Texas.
Production in North Dakota in 2008 averaged 155,000 b/d, up from the year-earlier average of 123,000 b/d due to increased output from the Bakken shale formation. Production also climbed last year in Colorado, Utah, Alabama, Mississippi, and Oklahoma.
Inventories
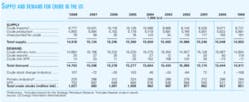
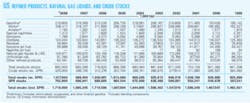
Industry stocks of crude and products will finish 2009 down from their unusually high end-2008 levels.
Stocks of crude, excluding those in the Strategic Petroleum Reserve, at the end of last year totaled 325 million bbl, more than 13% higher than a year earlier. Throughout 2008, refinery utilization rates were lower than normal. Utilization hovered around 85% all year, except in September, when Gulf Coast refineries experienced hurricane-related outages.
Product stocks will end 2009 at 689 million bbl, down from 692 million a year earlier. Total motor gasoline inventories at the end of last year sagged from the end of 2007, but the amount of gasoline blending components in storage grew 8% over the period.
At the end of 2008, inventories of jet fuel, residual fuel oil, and unfinished oils all stood below their year-earlier levels. Over this period, though, industry stocks of distillate fuel oil, propane and propylene, and other oils grew.
The SPR will add about 18 million bbl of crude this year. The Department of Energy announced plans earlier this month to purchase crude to take advantage of the recent decline in prices.
And from January through May of this year, the SPR will receive 5.4 million bbl of oil in payment for supply released to refiners in the fall of 2008 due to interruptions caused by Hurricanes Gustav and Ike, along with 120,000 additional “premium” barrels of oil that the refiners are required to pay.
The SPR will also receive 2.178 million bbl of royalty-in-kind oil, originally scheduled for delivery in 2008 and deferred until the spring of this year.
Refining
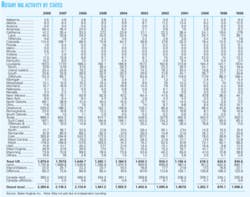
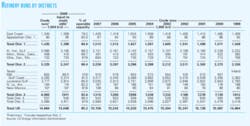
OGJ expects US refining activity to be a little stronger this year, with capacity utilization set to average about 86%. Operable capacity will average 17.7 million b/d vs. 17.61 million b/d last year.
In 2008, utilization averaged 85%, as spring maintenance caused the rate to dip to 83% in March, then hurricane-related interruptions to Gulf Coast refineries sent the September rate to just 74.6%.
While refiners continued to ramp up production of ultralow-sulfur diesel and scale back output of distillate with more than 500 ppm sulfur to meet fuel regulations, production of most other products was little changed during 2008.
Refiners paid more than ever for crude during 2008, and they saw their cash margins plunge from 2007 results.
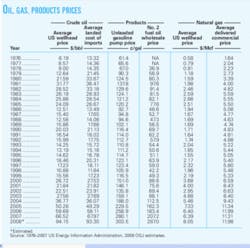
With a July average of more than $129/bbl, the composite cost of domestic and imported crude to US refiners last year averaged about $95/bbl. This compares to the 2007 average of $67.98/bbl.
Refinery maintenance was heavy in the spring of 2007, and cash margins spiked in May of that year. High crude cost sent them tumbling during 2008, until September’s outages gave margins a temporary boost. The 2008 average Gulf Coast cash refining margin was $9.01/bbl, according to Muse, Stancil & Co., down 29% from a year earlier.
Imports, exports
US imports of crude and products will slide this year as a result of waning demand. Total industry imports declined 2.5% last year and will fall another 2.6% this year.
Crude imports will average 9.55 million b/d, and product imports will average 3.22 million b/d. Net imports will supply 58.2% of US oil demand.
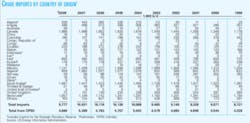
The sources of the largest volumes of US crude and product imports last year were Canada, Mexico, Saudi Arabia, Venezuela, and Nigeria.
US exports of crude and products will average 1.85 million b/d this year, up 4.2%. Last year, weaker demand caused total oil exports to soar 24% higher than a year earlier. Crude exports averaged 25,000 b/d, down from 2007, but product exports were higher.
Oil products
US oil product demand this year will be sluggish, but it will not drop as much as it did in 2008. OGJ forecasts that total domestic demand for products will average 18.755 b/d, down from 19.5 million b/d a year ago.
Demand for transportation fuels will be hit by the economy. Business and leisure travel as well as commercial transport will decline due to the pullback in spending.
Motor gasoline demand will decline by 2% to average 8.8 million b/d.
Last year, demand for the fuel fell more than 3%, declining for the first time since 1991. High pump prices deterred discretionary driving and spurred a trend toward the use of smaller and more energy-efficient vehicles.
For the week ending July 7, 2008, the pump price of regular unleaded gasoline in the US peaked at an average of $4.114/gal, according to the US Energy Information Administration. A year earlier the average was $2.959/gal.
By the end of last year, pump prices had sunk to levels not seen since early 2004. For the week ended Dec. 29, 2008, the pump price of regular unleaded averaged $1.613/gal. With geopolitical tensions pressuring oil prices, the pump price rebounded a bit to start this year, though, averaging $1.784/gal for the week ended Jan. 12.
While lower prices may encourage use, the poor economy will remain a drag on motor gasoline demand this year.
Demand for jet fuel will ebb along with business and leisure travel this year. Airlines will become even more efficient, driving down jet fuel demand a further 3% after last year’s 6.9% decline.
Distillate, other products
Distillate fuel oil demand will decline almost 4% this year, as less will be required for commercial transport. Diesel prices will remain at a premium to gasoline prices, although they have dropped from their mid-2008 high of $4.77/gal.
The most recent figures from EIA show that the price for highway (ultralow-sulfur) diesel averaged $2.324/gal for the week ended Jan. 12.
Demand for distillate averaged 3.945 million b/d last year, down from a year earlier by 6%.
About 80% of all distillate consumed in the US now is ultralow-sulfur diesel, with no more than 15 ppm sulfur. Most of the remaining distillate demand is for heating oil and is heavily dependent on weather.
Demand for residual fuel oil, mostly used in electric power generation, will decline about 5% this year. For 2008, resid demand was down more than 15%, as high oil prices discouraged use of the fuel.
The capacity of power generators to switch to resid as a fuel has greatly declined in favor of using natural gas, and resid demand has drastically declined since the early 1980s.
Slumping petrochemical production, construction, and fuel demand will suppress the use of all other products in the US this year. This group of products includes ethane, gasoline blending components, waxes, and other oils.
Demand for liquid petroleum gases will average 4.8% lower this year, following a 6% drop in 2008 to 1.96 million b/d. Meanwhile, at 2.245 million b/d, the use of all other products will slump 10%, the same decline as a year ago.
Natural gas
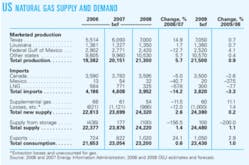
OGJ forecasts an increase in US gas demand this year of 1%, mostly related to power generation and home heating. Demand growth will be limited by a decline in industrial demand.
In 2008, gas demand climbed just 0.6% to an estimated 23.2 tcf as residential and commercial demand were nearly flat from a year earlier, according to early estimates. Electric power demand was slightly lower, canceling a small gain in industrial demand through the first 10 months of the year.
Gas prices plunged in the second half of last year along with oil prices as the amount of gas in storage climbed to the top of the 5-year range. US gas production grew for the year in spite of the Gulf of Mexico hurricanes.
Gas supplies will remain plentiful this year, and prices will be suppressed for a while, but production growth will slow. Drilling rates are declining already.
The Baker Hughes count of gas rigs reached as high as 1,606 in late August and September 2008; for the week ending Jan. 9, the count had fallen to 1,239 active gas-directed rotary rigs.
US production growth will be negligible in all areas except the deepwater Gulf of Mexico, where projects are based on long-term plans with large enough investments to be much less affected by price declines than projects elsewhere.
Gas output from the federal Gulf of Mexico will climb 4% this year, following last year’s storm-related decline of almost 13%. Marketed production this year will increase 0.7% in both Texas and Louisiana and will grow a combined 0.4% in all other states.
Imports will decline 3.3% in total, with slumps in both LNG and volumes via pipeline from Canada and Mexico.
In 2008, higher prices elsewhere diverted LNG volumes from the US. As a result, the US imported 58% less LNG than a year earlier. OGJ expects volumes this year will total 300 bcf, an almost 8% decline from last year.
US gas exports will increase 3%, slowing from last year’s 24% advance. About 100 bcf of this year’s gas supply will come from storage, relieving some pressure on stocks.
The amount of working gas in storage finished 2008 at about 2.83 tcf vs. the end-2007 storage level of 2.8 tcf.
