Special Report: FIRST OF TWO PARTS—Alaskan tax reform: Intent met with oil
The two-part series beginning here takes a detailed look at a crucial element of Alaskan production: taxes. This week’s installment argues that recent reforms have been successful from the state’s perspective. But how will they affect efforts to encourage gas development? The authors address that question next week.
In 2006 and 2007 the State of Alaska undertook fundamental reforms to its oil and gas production tax, making it much more progressive. Among the goals of these reforms, two were key. One was to capture more value for the state at higher energy prices. As the legislature was debating the reforms in 2006, prices for Alaska North Slope (ANS) crude for the first time crossed the $40/bbl barrier.
An equal or more important goal was to improve the environment for attracting investments needed to slow or reverse the decline in the state’s oil production. Forecast to average 701,000 b/d in the current state fiscal year of 2009, production had exceeded 2 million b/d in the late 1980s.
This article will show that the 2006-07 production tax reforms were phenomenally successful for the state. Alaska collected several billion dollars in additional oil production tax revenue as prices for ANS crude peaked above $140/bbl in the summer of 2008. The state’s take from the tax hike was almost 500% higher than it would have been without the reforms.
However, as oil production declines from supergiant Prudhoe Bay field, which anchors the North Slope, the focus in the state has turned toward Alaska’s immense reserves of unexploited natural gas.
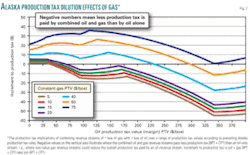
If sufficient investment can be attracted to build a pipeline to transport gas from the North Slope to market, a feature of the state’s production tax may limit performance under high oil prices similar to the 2008 spike. Although it is too early to tell how well the second goal of increased investment has been achieved, in this series we identify additional concerns about how some of the investment incentives might work if a new pipeline to export gas is added to the mix.
The fiscal system
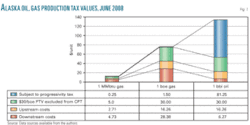
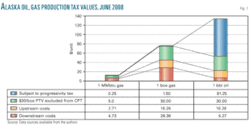
State government in Alaska gets most of its general-fund revenue from four oil and gas mechanisms that are a mixture of progressive and regressive elements. Over the past decade, depending on prices, oil and gas have provided 68-93% of the state’s general-fund revenues. The components of the state’s fiscal system are summarized in Fig. 1.
Because most oil and gas production is from state land, royalty paid to the state averages just under 13% of gross value, less costs to get the commodity to market. This is regressive because it does not factor in the investment required or the expense of finding, developing, and producing the oil or gas. Alaska’s fiscal design for oil and gas has evolved substantially in the past 3 years and consists of four mechanisms (Fig 1).
There also is a property tax of 2% of assessed value on oil and gas real property (though not on the lease or hydrocarbons). The tax is split between the state and the municipalities in which the property is located. This is relatively insensitive to the profits (or losses) generated by changes in the price of the oil or gas in the market.
There is a corporate net income tax (abbreviated here as CIT but defined by the Alaska Net Income Tax Act or ANITA) of 9.4% of that portion of an oil-and-gas producing taxpayer’s worldwide income apportioned to Alaska. While this is an income-based tax, the link with specific Alaska investments, costs, and income is weakened by the apportionment mechanism—an equal weighting of production, sales, and property. Higher operating costs in Azerbaijan or Alaska will have the same depressing effect on the income taxable in Alaska. Higher prices on out-of-state sales of ANS or Angola crude will increase the amount of Alaska CIT paid equally.
The final mechanism is the oil and gas production tax, which has changed substantially over the past 3 years. The next section sets out its history, politics, and mechanisms in more detail. These four mechanisms can be very different. For example, each approaches depreciation or the cost-allocation mechanism for upstream capital investment differently. For royalty there is no deduction driven by upstream investment, so no mechanism is needed. For the property tax, units of production essentially determine the rate of depreciation.
The corporate income tax preserves the pre-1980 asset depreciation range (ADR) system from federal income tax, while the production tax allows instantaneous depreciation or expensing of capital costs. Meanwhile, a producer in Alaska will be subject to US federal income tax (FIT) with its current modified accelerated cost-recovery system (MACRS).
Alaska’s hydrocarbon production comes primarily from the North Slope, with oil and some natural gas liquids sent through the trans-Alaska oil pipeline (TAPS) and tankers to US West Coast refineries.
North Slope oil production in FY 2008—including natural gas liquids mixed with crude and shipped through the pipeline—totaled roughly 261 million bbl, or 716,000 b/d. Annual average net gas recovery is closer to 500 MMcfd, although most of that is nontaxable gas used for enhanced oil recovery and as fuel to run North Slope production facilities.
Most taxable gas comes from a smaller production center in Alaska’s Cook Inlet, now a gas province where the gas is used mostly in local population centers, with some export from an LNG facility. However, Cook Inlet accounts for less than 5 million bbl of the state’s annual oil production. While other areas of the state and offshore show prospectivity for oil or gas, none has yet been commercialized. Major North Slope gas sales await a pipeline to carry the gas to markets, leaving a valuable resource stranded at the northern edge of North America.
Tax before reform
Prior to reforms discussed in this article, Alaska’s oil production tax was a maximum 15% of gross value (calculated under the same general principles as royalty), multiplied by the so-called economic limit factor (ELF). The ELF was 0.0 for small fields (hence leading to zero tax), and by 2006 averaged about 0.5 for fields with a positive ELF, for an effective tax rate of less than 8% of gross.
Although the nominal tax on gas was 10%, and the ELF mechanism involved a different calculation, by 2006 the effective rate on gas was also coincidentally around 8% of the gross. Price was not a factor in calculating the ELF multiplier. The ELF, adopted in 1979 and amended in 1989, was intended to reduce production taxes on smaller, less productive, older, and declining fields.
In 2006, then-Alaska Gov. Frank Murkowski proposed replacing the gross tax and ELF with a 20% tax rate (base production tax, referred to then as PPT but referred to in this article as BPT) applied to the net. The tax would be applied after allowing a deduction for upstream exploration, development, and production costs.
Furthermore, to make investment more attractive, capital investment could be deducted as a cost as spent and also would generate an additional 20% credit applicable against the BPT. The proposal came to be known as the 20:20 PPT proposal.
Murkowski introduced this oil tax reform to complement a gas pipeline fiscal contract negotiated under the Alaska Stranded Gas Development Act with the state’s three largest holders of gas-rich leases: BP, ConocoPhillips, and ExxonMobil. The administration hoped that the fiscal stability built into that contract would create a viable investment climate to enable financing and construction of a gas line to the Lower 48.
After extensive hearings consuming the better part of several special legislative sessions, the legislature passed a reformed oil and gas production tax in August 2006, retroactive to Apr. 1, 2006. Although the key ideas from Murkowski’s proposal remained intact, the legislature imposed its own amendments to the administration’s proposal and added a higher base tax rate and a progressivity mechanism.
This progressivity feature, called here the combined progressivity tax (CPT), added an extra 0.25% to the overall tax rate for every dollar the per-barrel net (production tax value, or PTV) was above $40 (until the CPT rate reached a maximum of 25%). For example, if per-barrel costs were $25 and that barrel could be sold for $85, an additional 5% CPT would be added to the base production tax rate.
How was this CPT calculated? For the sake of simplicity we will ignore royalty and start with $85/bbl oil and subtract $25 in costs to yield a PTV of $60. Subtracting the $40 progressivity trigger from the $60 yields $20. The CPT rate was calculated as 0.25% times $20, which equals 5% additional tax above the base rate. The legislature (along with many other changes) also increased the BPT to 22.5% from the proposed 20%, so in this example the nominal tax rate would be 27.5%, the sum of 22.5% BPT and 5% CPT.
Meanwhile, the legislature declined to take up Murkowski’s controversial gas-line contract. Natural gas production taxes, however, were included in the oil-reform legislation. Under the new law, any taxable gas was converted to oil on an energy-equivalent basis at the rate of 6 MMbtu/bbl (which for a cubic foot of gas with a heating value of exactly 1,000 btu equals 6 Mcf/bbl). Then these energy-equivalent barrels of gas were added to the oil for the calculation of progressivity. We call this the combined progressivity tax (CPT) because oil and gas are taxed under a single combined formula.
The tax-reform legislation was created for oil but was applied to all hydrocarbon production. The consequences of this are explored in next week’s article. To protect in-state consumers, the legislature capped the production tax on Cook Inlet gas at its existing ELF-calculated rates and values.
Reform approved
August 2006 was a pivotal month. On Aug. 10 the legislature voted to approve the production tax reform, including the reforms detailed above. On Aug. 19 Murkowski signed the legislation into law. On Aug. 22 Sarah Palin won the Republican gubernatorial primary with more than 50% of the vote, relegating Murkowski—with only 19% of the vote—to third place.
Then, on August 30, agents of the Federal Bureau of Investigation raided the offices of six legislators, carrying off in their gloved hands boxes of papers, documents, and computer hard drives. Publicly available warrants made clear the FBI was seeking information relating to votes on the PPT and the activities of VECO, an oil field services contractor active in the tax debate.
Palin went on to win the November 2006 election. She campaigned—in part—on returning the production tax from a net tax back to a gross tax. It was not until April 2007 that taxpayers had to file returns for 2006 under the new law. Although the state had predicted catch-up payments from North Slope producers of close to $1 billion, the checks totaled $880 million, and the new administration expressed concern over compliance.
In August 2007 indictments were finally brought against VECO officials and three of the legislators whose offices had been raided a year earlier (only one was still a sitting legislator). Subsequent VECO-related charges have been brought against one other legislator, a former legislator, US Sen. Ted Stevens (who later lost his reelection bid in November 2008) and Murkowski’s chief of staff, resulting in three guilty pleas and Stevens’s conviction, subsequently vacated.
Palin in September 2007 called a special legislative session to modify the production tax reforms and adopt a production tax that Alaska’s citizens could believe was free of corruption. Her administration, after consulting widely with outside experts, did not propose a return to a gross tax and renewed its commitment to a net tax. Her proposal—tagged as ACES, or Alaska’s Clear and Equitable Share—included raising the BPT from 22.5% to 25%.
The governor also proposed (1) that for purposes of administrative ease, progressivity be calculated on an annual basis instead of monthly, (2) the progressivity trigger would kick in at $30/boe instead of $40/boe, and (3) the rate of progressivity would increase more slowly at 0.2% per $1 above the trigger instead of 0.25%.
The legislature met in special session during October and November 2007 with oil prices in the $80/bbl range—about double where they had been during the 2006 special session. Just as it did when adopting the original reform under Gov. Murkowski’s tenure, the legislature also imposed its own distinctive stamp on the law adopted under Gov. Palin—again focusing on progressivity.
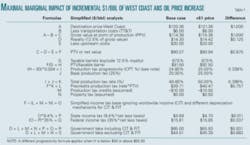
The BPT was increased to 25%, as the governor had requested. However, the CPT remained on a monthly basis, and while the trigger dropped to the suggested $30/per boe, the rate was increased to 0.4%/$1 above the trigger. Using the example above of $85/bbl oil and $25/bbl costs, the total production tax rate becomes 37%. The BPT is 25%, and the CPT calculation is still $85 less $25 for a PTV of $60/bbl. But then subtracting the $30/bbl trigger and multiplying the resulting $30 times 0.4% yields a CPT of 12% and a total tax of 25% + 12%, or 37%. As detailed above, this example produced a 27.5% total tax rate under the 2006 law. The less simplified version that includes royalty can be seen in Table 3. (At PTVs above $92.50, the progressivity increment fell to 0.1%/1 above the trigger, while total progressivity was capped at 50%.)
Capturing premiums?
In 2008, oil prices hit extraordinary levels. How did the legislature do at capturing those premiums? There are several ways of looking at this, and we present two.
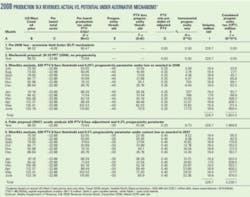
The first looks at the increase in production taxes from fiscal 2004 through 2008 (Table 1).
While Column B of Table 1—annual production tax revenue—shows the increase is more than an order of magnitude from roughly $650 million to $6.9 billion, it doesn’t tell how much of the change was due to the change in rules and how much was due to change in prices, production, or costs. At least the first two can be factored out in the following exercise. Column G of Table 1 shows that from fiscal 2004 to 2008 the product of market value times volume roughly doubled.
Similarly, Column J of Table 1 shows the royalty—rules for which didn’t change—paid to the state over the same period doubled. Thus it appears the net effect of the change in tax was the tenfold increase divided by twofold increase caused mostly by rising oil prices. That is a fivefold increase caused by the change to the production tax fiscal mechanism. (More specifically 10.7 divided by 2.2 equals 4.9.)
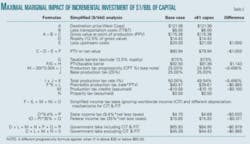
Another way of comparing these is to look at the high prices that prevailed in fiscal 2008 and assuming both constant costs and volumes to evaluate them under the five different production tax designs discussed from 2005 to 2007. Table 2 summarizes such an analysis.
Table 2 also confirms a fivefold increase due to the tax reforms excluding oil price changes. Murkowski’s proposal would have been a doubling of the production tax from the ELF-driven tax structure in 2006. That year, the legislature made that a tripling over the status quo. Palin’s 2007 proposal would have had little effect under the prices that were realized in fiscal 2008, but the legislature pushed up the progressivity feature to achieve the nearly fivefold increase illustrated.
Methodology No. 5 is the prevailing regime, so we can compare this piece of the simplistic table with actual results. This simplified model produces a production tax liability of $7,032.2 million, about 3% different from the actual production tax liabilities for fiscal 2008, $6,867.3 million as seen in the last row of Column B of Table 1. Given that Table 2 uses a single average price, while the tax effects from deviation from the average are not symmetrical, and this analysis ignores other details such as the small producer tax credit, this is a surprisingly close match.
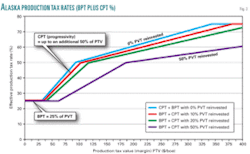
Fig. 2 illustrates the dollars flowing to the state from the three methods illustrated in Table 2 which incorporate a progressivity feature. Monthly increments from the original method enacted in 2006 (Methodology No. 3 on Table 2 with a 0.25%/$ factor and $40/boe PTV threshold) are compared to monthly increments from the revised method enacted in 2007 (Methodology No. 5 on Table 2 with a 0.4%/$ factor and $30/boe PTV threshold). The flat line on Table 2 illustrates the annual application of progressivity as proposed by the Palin administration in 2007 (Methodology No. 4 on Table 2 with a 0.2%/$ factor and a $30/boe PTV).
We do not have sufficient data to say whether the goals pertinent to increased investment are being achieved. Furthermore, whatever capital budgeting announcements made by producers when prices were high must be reexamined in the context of lower crude oil price environments. Pioneer brought on the new 90 million bbl Oooguruk field in August of 2008 under the new fiscal regime, but Eni in March 2009 announced it was delaying development at Nikaitchuq, a $1.5 billion project.
Acknowledgment
Dan E. Dickinson and David A. Wood have performed and continue to perform advisory and evaluation work for Alaska’s Legislative Budget and Audit Committee on Alaska’s oil and gas fiscal design. That work is now in the public domain. However, the ideas expressed here are the authors’ own. Larry Persily provided extensive editorial assistance.
Bibliography
Alaska Department of Revenue, Fall 2008 Revenue Sources Book. (http://www.tax.alaska.gov/programs/documentviewer/viewer.aspx?1531f), December 2008
Black & Veatch, AGIA NPV Analysis Report, May 2008.
Dickinson, Dan E., “Alaska’s Oil and Gas Taxes: the 2006 Reform, 2007 Reform, and Beyond,” (http://lba.legis.state.ak.us/), December 2008.
Wood, David A., Preliminary Report on Fiscal Designs for the Development of Alaska Natural Gas. (http://lba.legis.state.ak.us/), December 2008.
The authors
Dan E. Dickinson ([email protected]) is a certified public accountant in practice in Anchorage, Alas. He also holds the CMA (certified management accountant) designation. Previously Tax Division director for the State of Alaska, he holds a degree in lunar geology from Brown University in Providence, R.I. Dickinson consults widely with state government, local government, and private industry on tax, royalty, and fiscal issues. Dickinson was registered as a lobbyist for the administration during the 2006 Alaska legislative sessions and was on contract to the legislature during much of the 2007 special sessions.
David A. Wood ([email protected]) is an international energy consultant specializing in the integration of technical, economic, fiscal, risk, and strategic information to aid portfolio evaluation and management decisions. He holds a PhD from Imperial College, London. Research and training concerning a wide range of energy related topics, including fiscal design, gas, LNG, GTL, project contracts, economics, and portfolio and risk analysis, are key parts of his work. Wood is based in Lincoln, UK, and operates worldwide. His web site is www.dwasolutions.com.
