Algorithm helps define final 3D seismic survey polygon
The design of a 3D seismic survey depends on a number of field parameters that control the patch geometry and layout of source and receiver lines.
A 3D seismic survey is planned over a subsurface geologic target area, usually picked from interpreted 2D migrated seismic data. Due to the presence of dips, this migrated subsurface area is expanded into unmigrated surface area, which in turn is further expanded into the final survey area, in order to get full fold coverage over the target area.
In most cases, except star and radial layouts, the initial design starts with source and receiver lines in the form of a rectangular grid, which is interactively clipped at the edges according to the shape of the expanded geologic target area.
Several software applications are available with a whole range of 3D survey design and analysis capabilities, but they do not provide an automated procedure for geologic target area expansion and clipping of source and receiver lines within the final survey boundary.
This article presents an algorithm for expanding the subsurface geologic target area polygon into the final survey area polygon, on the basis of migration aperture and fold taper zone and finally, clipping the source and receiver lines within this expanded survey area polygon. The working of the algorithm is demonstrated through a practical example.
Introduction
In a 3D seismic survey, exploration objectives of delineating the geologic target are achieved through optimization of seismic acquisition parameters, which in turn govern the bin size, patch geometry, template movement, and subsequent field layout design. Cordsen et al.1 discussed in detail these parameters, their relationship with patch geometry, and selection of appropriate field layout design that fulfills these objectives.
Several software applications are available for planning and design of 3D surveys. In most of these applications the field layout is initially designed with respect to an arbitrary origin and bounded by a rectangular box oriented along zero azimuth.
After analysis of parameters, the final layout is georeferenced by assigning real geodetic coordinates to its origin and rotated to align along the survey azimuth, which usually approximates the dip direction of the subsurface target structure.
To make the survey cost-effective, the edges of the rectangular layout boundary are interactively edited, according to the shape of the target area, by deleting all source and receiver points that lie outside the survey boundary.
This survey boundary is usually computed, through a spreadsheet, by adding the widths of migration aperture and fold taper to all the edges of the geologic target area. The values of these widths vary for each direction therefore they are computed separately for each edge.
In this article an algorithm is presented that automatically expands the geologic target area polygon according to the widths of migration aperture and fold taper computed for each edge, aligns the edges along or perpendicular to the survey azimuth, and finally computes the survey area boundary. It also provides the exact georeferenced coordinates for the origin of the source-receiver lines grid layout and automatically clips all source and receiver points lying outside the survey boundary.
Polygon processing algorithm
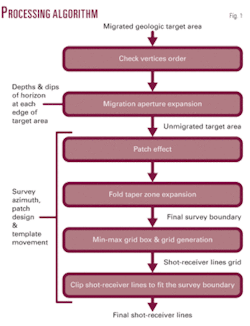
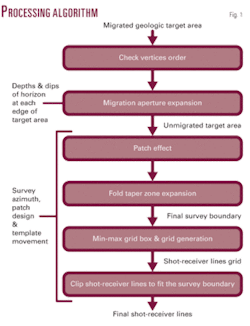
All steps in the algorithm are summarized in Fig. 1. A practical example is used to discuss and show the results of these steps.
A geologic target area polygon is represented by n vertices; (x1, y1), (x2, y2), …(xn, yn) with last vertex repeated as (x0, y0) to close the polygon. To expand the polygon in the outwards direction, the polygon vertices must be in clockwise order.
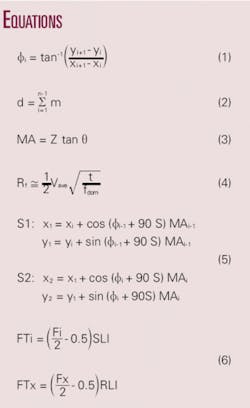
The algorithm must check the order of vertices and reorder them into clockwise, if found counterclockwise. Bourke2 has suggested separate methods for determining the vertices order of convex and concave polygons. We have implemented a much simpler approach as discussed below. The geometric angle for a polygon edge is given by Equation 1 where i ranges from 0 to n-1, to get the angle for each polygon edge. Now to find the order of polygon vertices we have Equation 2 where m = 1 when Øi-1 –Øi >0 and m = –1 when Øi-1 Øi <0. Thus for a clockwise order the value of d is positive, while for a counterclockwise order its value is negative.
This approach has been found successful in determining the vertices order of convex, concave, as well as complex polygons as shown in Fig. 2.
The geologic target area is usually based on migrated data. To allow proper migration of any dipping events, this target area must be increased for full-fold coverage by adding the migration aperture width to each side.
The migration aperture in a constant velocity medium is given by Equation 3 where Z is depth and θ is dip of the subsurface structure. The migration aperture must be greater than the radius of Fresnel zone which for zero offset is given by Sheriff3 in Equation 4 where Vave is average velocity, t is arrival time, and fdom is the dominant frequency.
The migration aperture must be optimized for quality results as very small aperture causes suppression of steeply dipping events, while a very large aperture significantly increases acquisition costs without improving the quality.4 5
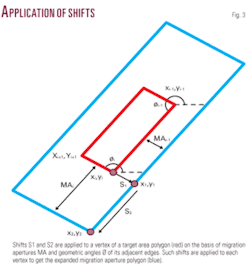
The value of migration aperture simply gives the widths to be added to the respective edges of the target polygon or the shifts to be applied to polygon vertices for expansion. It does not give any idea about the direction of shift. Practically each vertex is applied two shifts S1 and S2 perpendicular to its two adjacent edges in the outwards direction as illustrated in Fig. 3. The geometric angle Ø (Equation 1) and migration aperture MA (Equation 3) are computed for each edge of the polygon, which in turn are used for calculating the two shifts as given in Equation 5 where S = 1 when d 0: clockwise order. S = –1 when d <0: counterclockwise order.
Such shifts are computed and applied to each vertex of the target polygon to get the migration aperture polygon as shown, through an example, in Fig. 4.
The edges of this migration aperture polygon must be along or perpendicular to the survey azimuth and their respective lengths must be according to the size of the patch and its template movement increments. This adjustment is done through pattern analysis of the shape of the polygon.
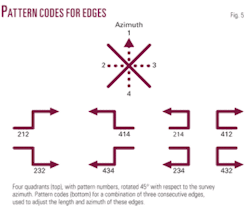
In this analysis four quadrants are created with respect to ±45º of the survey azimuth and its opposite and perpendicular directions. Each quadrant is assigned a pattern number as shown in Fig. 5. Each edge of the migration aperture polygon is assigned a code on the basis of its azimuth lying in any one of the four quadrants.
In this way pattern codes are created for three consecutive edges (Fig. 5). These pattern codes are used to analyze the shape of the polygon with respect to patch orientation, size, and movement and accordingly adjust the length and azimuth of its edges.
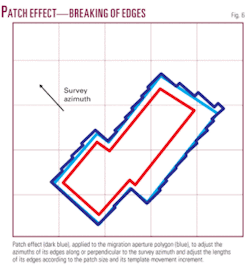
If the edges of the migration aperture polygon are not along or perpendicular to the survey azimuth, then this adjustment breaks an edge into smaller edges that are aligned with respect to the survey azimuth, and their lengths are in accordance with the patch size and its template movement increment.
This breaking of edges is called patch effect, which is illustrated for the given example in Fig. 6. It must be noted that if the edges of the migration aperture polygon are already along or perpendicular to survey azimuth then the patch effect is not generated. In the given example (Fig. 6), we intentionally created a small difference in the survey azimuth and polygon edges to create the patch effect.
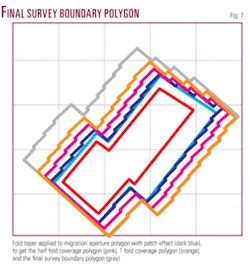
This adjusted migration aperture polygon is the area where full fold is required. Thus the fold taper zone must be computed along the in-line and cross-line directions and added to this polygon, similar to migration aperture, to get the final survey area polygon. Fig. 7 shows half fold coverage, one fold, and final survey boundary polygons for the given example. The in-line fold taper FTi and cross-line fold taper FTx are given by Cordsen et al.1 in Equation 6 where Fx and Fi are cross-line and in-line folds, respectively, RLI is receiver-line interval, and SLI is source-line interval.
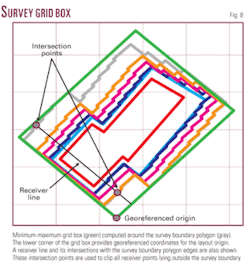
To find the georeferenced origin and size of the field layout, the minimum and maximum limits of the survey boundary polygon are computed in rotated axis. This can be done by applying a rotation, equal but opposite to the survey azimuth, to all the vertices of the polygon and finding the minimum and maximum limits to get a min-max grid box.
The four vertices of the min-max grid box are rotated back to the survey azimuth (Fig. 8). One of its corners represents the georeferenced origin. Fig. 8 also shows a receiver line and its two intersection points with the edges of survey area polygon. All points lying between these intersection points are taken into account while the rest are deleted. In this way all source and receiver lines are clipped within the survey boundary.
Clipping example
Finally for the above discussed example, an orthogonal source and receiver lines grid is generated, with respect to the georeferenced origin and having a receiver interval of 50 m, source interval of 100 m, and source and receiver lines interval of 200 m.
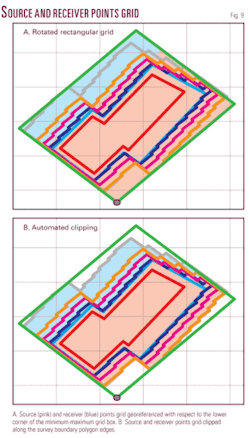
The patch consists of 6 receiver lines each with 80 receiver stations and an end-on shooting template. As shown in Fig. 9a, the source and receiver lines are in the form of a rotated rectangular grid.
Due to the high costs of a 3D seismic survey, this rectangular grid needs to be clipped within the survey boundary in order to provide full fold coverage only at the desired unmigrated target area. Fig. 9b shows automated clipping of source and receiver lines grid according to the final survey boundary.
The result
The presented algorithm expands the initial unmigrated target area polygon to get the final survey boundary polygon, on the basis of migration aperture and fold taper zone.
It automatically determines the shift directions to be applied to each vertex for polygon expansion and aligns the edges along or perpendicular to the survey azimuth.
The algorithm also provides the exact geodetic coordinates of the origin with respect to which the field layout is georeferenced and clips all source and receiver points lying outside the survey boundary. It can be successfully applied to all field layouts, except star and radial designs.
References
- Cordsen, A., Galbraith, M., and Pierce, J., “Planning Land 3-D Seismic Surveys,” Geophysical Developments No. 9, SEG, 2000, pp. 13-16.
- Bourke, P., “Determining whether or not a polygon (2D) has its vertices ordered clockwise or counterclockwise,” 1998 (http://local.wasp.uwa.edu.au/∼pbourke/geometry/clockwise/index.html#clockwise).
- Sheriff, R.E., “Nomogram for Fresnel-zone calculation,” Geophysics, Vol. 45, 1980, pp. 968-972.
- Schleicher, J., Hubral, P., Tygel, M., and Jaya, M.S., “Minimum apertures and Fresnel zones in migration and demigration,” Geophysics, Vol. 62, 1997, pp. 183-194.
- Sun, J., “On the limited aperture migration in two dimensions, Geophysics, Vol. 63, 1998, pp. 984-994.
The authors
Khalid Amin Khan (aminkhan @k-tron.net) is a research geophysicist and instructor at the Oil & Gas Training Institute of Oil & Gas Development Co. Ltd. He has 18 years of experience in geophysical software development, seismic data processing, and systems management. He has also worked for some time with CGG as a geophysical systems engineer. In 1998, he founded K-tron Research, a geophysical software company, where he has been involved in the development of various geoscientific applications. He holds an MSc from Quaid-i-Azam University, where he is a visiting faculty member.
Muneer Ahmad Khan joined OGDCL as field geophysicist and later worked as geophysical analyst at the company’s seismic data processing center. He received training in seismic data processing from Digicon USA using DISCO software, and transferred to the Oil & Gas Training Institute in 1998. He presently works as chief geophysicist-instructor exploration and is engaged to develop and deliver new courses in seismic exploration. He has an MSc (geophysics) from Quaid-i-Azam University.
Ghulam Abbas is a quality control geophysicist on a seismic crew of OGDCL. He has 17 years of experience involving field operations, quality control, and 3D seismic survey design. He holds an MSc in geophysics from Quaid-i-Azam University.
M. Gulraiz Akhter ([email protected]) is an assistant professor in the Department of Earth Sciences at Quaid-i-Azam University. His areas of interest are exploration geophysics and numerical groundwater modeling. During his 20 years of experience, he has taught mathematics, geophysics techniques, and hydrogeology. He has a masters in geophysics and a PhD in hydrogeology from Quaid-i-Azam University.
Zulfiqar Ahmad is professor and chairman, Department of Earth Sciences, Quaid-i-Azam University. He worked as geophysicist/hydrogeologist with Saindak Metal for 7 years and developed the potential groundwater aquifers in the Tahlab Valley in northwestern Baluchistan near the Iran border. He carried out geophysical studies on electrical resistivity, gravity surveys, and geophysical well logging of boreholes in Tahlab. His work experience includes teaching, research, and administration. He has a PhD with specialization in numerical groundwater flow and solute transport computer modeling from the University of Kentucky, an MSc in hydrogeology from University College, and an MSc in geophysics with specialization in gravity prospecting from Quaid-i-Azam University.
