Dry gas internal corrosion direct assessment (DG-ICDA) can be an effective means of evaluating networks of pipe for internal corrosion. Evaluating large networks of pipe in a single assessment results in reduced project time requirements.
In cases where in-line inspection was used as the integrity assessment method addressing internal corrosion on a trunkline and where no gas additions between purchase points and no history of internal corrosion in any of the laterals or the common trunkline, multiple laterals that tap off the same trunkline can be combined into one ICDA region. This method achieves the objectives of DG-ICDA while eliminating unnecessary digs and project reporting, ultimately decreasing project scope.
Evaluating the typical system operating conditions for an extended period and evaluating the effects of changing pipeline operating conditions on calculated critical angles can reduce error in determining places along a pipeline where fluid or other electrolyte may reside.
Background
DG-ICDA identifies areas along the pipeline where fluid or other electrolyte introduced during normal operation or by an upset condition may reside, then focuses direct examination where internal corrosion is most likely to exist. ICDA seeks to identify the potential for internal corrosion, allowing an operator to prevent any discovered internal corrosion defects from growing to a size that threatens the structural integrity of the inspected pipeline segments.
Operators of gas transmission pipelines, in accordance with 49 CFR 192.921, must assess the integrity of their pipelines in each covered segment based on the threats to which the covered segment is susceptible.1 Piedmont Natural Gas chose DG-ICDA as the assessment method to identify if the threat of internal corrosion existed in its South Carolina transmission pipeline system.
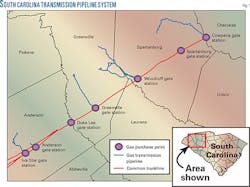
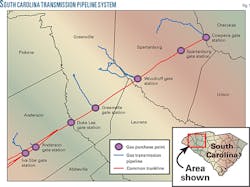
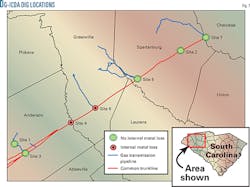
This project followed requirements of the company’s written ICDA plan. The plan used in this project accorded with the Department of Transportation 49 CFR 192 Subpart O, Pipeline Safety: Pipeline Integrity Management in High Consequence Areas (Gas Transmission Pipelines); Final Rule. The plan also used procedures and protocols developed by Northeast Gas Association (NGA), Gas Technology Institute (GTI), National Association of Corrosion Engineers International (NACE), and the efforts of outside consulting services (Structural Integrity Associates Inc.).The company’s system in South Carolina consists of 35 named pipeline segments comprising about 136 miles of pipe. Fig. 1 shows the system’s 14 primary laterals, originating from 7 gas purchase points along a common trunkline. Gas in the trunkline travels from south to north, supplying each of the company’s seven purchase points.
Region identification
An ICDA region extends from where liquid may first enter the pipeline and encompasses the entire area along the pipeline where internal corrosion may occur and where further evaluation is needed.
The criteria for determining the endpoint of an ICDA region as defined by the company’s written DG-ICDA plan are:
- Entrance point of gas at a purchase point (i.e., gate station).
- End of transmission gas flow (i.e., into an intermediate high pressure or low-pressure regulator station).
- Gas flow null point from two different gas sources.
Based on these criteria, the company could consider each lateral or purchase point off the common trunkline in its South Carolina system as an individual DG-ICDA region. This method would result in unnecessary digs and increased project reporting needs, ultimately increasing project scope. Several laterals in the system also are relatively short and completing the necessary digs would not be feasible. These circumstances required development of an alternative approach.
The company’s written DG-ICDA plan bases identification of ICDA regions on the source of gas. If liquids are not present at the gas source they would likely be absent in downstream laterals. If two lines therefore have the same gas source, they can be considered one ICDA region. The same philosophy can apply to multiple laterals originating from a common trunkline. In cases that used in-line inspection as the integrity assessment methodology to address internal corrosion on the trunkline on which there are neither gas additions between purchase points nor a history of internal corrosion in any of the laterals or the common trunkline, multiple laterals tapping off the same trunkline can be combined into one ICDA region.
The company’s system has 14 primary laterals originating from 7 separate purchase points. The purchase points receive gas from a trunkline network of 4 mainlines. The company asked the upstream gas supplier whether it had seen internal corrosion on the 4 mainlines supplying the system and whether the gas in the 4 mainlines is commingled. The upstream supplier reported completing ILI on sections of 3 mainlines without finding internal corrosion. It also reported no gas additions in South Carolina and commingling of the gas within the 4 mainlines.
Since gas in the mainlines is commingled and neither the supply gas pipelines nor pipelines in the company’s system has a history of internal corrosion, the system was evaluated as one ICDA region.
Representative flow
Technicians must establish flow conditions that represent typical system operation for each DC-ICDA region to calculate critical angles. Corrosion’s state as a time-based phenomenon requires consideration of the days per year a system operates at a given set of conditions.
Selecting flow conditions based on preestablished system conditions (i.e., maximum, minimum, or mean conditions) does not consider actual system operation. Conditions such as maximum or minimum typically occur on a few days each year. Observers would not expect to find extensive internal corrosion at sites determined by these conditions.
A statistical analysis approach evaluating system operation for an extended period serves as a preferred method for determining representative operational flow conditions. Such an analysis evaluates how long the system operates at a given set of conditions and allows the user to select conditions (maximum, minimum, mean, etc.) based on duration and system operation rather than a preestablished condition.
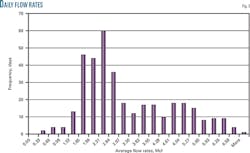
The company’s system underwent a statistical analysis with daily average flow rate information for 1 year at each of the seven purchase points, creating histograms plotting the daily average flow rate data at each of the seven purchase points. This analysis identified the characteristics (i.e., unimodal, multimodal, etc.) of the distributions as well as determining the mean flow condition and establishing delta flow conditions at 1 standard deviation (s).
Critical anglesFig. 2 shows a sample daily average flow rate histogram. During normal operation of the system any liquid will likely migrate to positions predicted by the mean and mean+1s flow conditions. Mean and mean+1s flow rate data provided the basis for calculating critical angles and direct examination sites.
Determining locations along a pipeline where fluid or other electrolyte may reside is critical in the DG-ICDA process. This determination requires calculation of critical angles based on pipeline operating conditions. The company’s written ICDA plan states either the standard GRI 02/0057 model equations or the modified GRI 02/0057 model can be used to calculate critical angles. The typical system operating conditions and the discrete pipeline information available prompted selection of the modified GRI 02/0057 model. This model allows calculation of the critical angle over a continuous range of flow conditions with a single equation (see box).
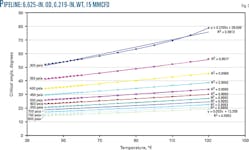
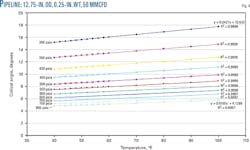
Figs. 3 and 4 show plotting critical angle vs. temperature results in the appearance of a linear relationship with a slight parabolic trend for relatively high critical angles. For a given set of operating conditions with critical inclination angles less than 45°, the relationship is roughly linear and the rate of change in critical angle due to temperature fluctuations can be considered constant. For a given set of operating conditions, therefore, a 20° F. temperature fluctuation from 60° to 80° F. would result in the same change in critical angle as a fluctuation from 80° to 100° F. The arcsine function in the equation suggests this relationship.Reducing errors in determining locations along a pipeline where fluid or other electrolyte may reside requires understanding the effects of changing pipeline operating conditions. The modified GRI 02/0057 equation shown in the accompanying box allowed a parametric study in which temperature, pressure, diameter, and flow rate conditions were varied to better understand the effect of data variability on the calculated critical angle.
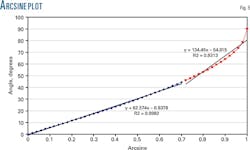
Plotting the arcsine function (Fig. 5) yields a linear trend for angles up to about 45°. Angles greater than 45° have a less linear relationship and a more parabolic slope.The rate of angular change is minimal at low critical angles and becomes increasingly important approaching 90°.
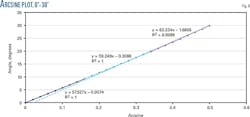
Plotting critical angle vs. temperature for a range of operating pressures shows that an increase in pressure results in a decrease in critical angle. Since flow rate data are calculated in million cubic feet per day, pressure is part of the conversion to determine actual gas flow and the resulting superficial gas velocity (at operating temperature and pressure). For a fixed superficial gas velocity, a change in pressure only affects the density of the gas, and therefore critical angle increases with pressure.As the critical angle decreases, the rate of change in critical angle with respect to temperature also decreases (Figs. 3-4). Plotting the arcsine function from 0° to 30° (Fig. 6) shows that for critical angles less than 30° the slope increases by 3% between 10° and 20° and 7% from 20° to 30°.
Similarly, plotting critical angle vs. temperature for a range of operating pressures shows that the change in angle with respect to temperature increases with a decrease in pressure. Fig. 3 shows at 300 psia a temperature change of 1° F. results in a 0.28° change in critical angle. At 800 psia, however, a temperature change of 1° F. results in a 0.05° change in critical angle.
The derivative of the modified GRI 02/0057 equation with respect to temperature not eliminating the effects of pressure suggests this trend.2 3 The change in critical angle with respect to temperature depends on pressure.
Decreases in flow rate or increases in ID result in decreasing critical angles. Similar to changes in pressure, decreases in flow rate and increase ID also result in a decrease in the rate of critical angle change with respect to temperature.
Pressure, diameter, and flow rate are interdependent variables with nonlinear responses to temperature changes. An increase in pressure has the greatest effect on critical angles at low pressures. Fig. 4 shows that at 300 psia and 70° F., an increase of 50 psi results in a change in critical inclination angle of 2.7°. At 750 psia, however, the same shift results in a change in critical inclination angle of 0.4°. The percentage change in pressure partially explains this difference. The shift from 300 to 350 psia results in a 17% pressure change. But the shift from 750 to 800 psia results in a 6% change.
A dependent effect is associated with the relative inclination angle as a function of pressure. At lower pressures, the relative inclination angle is greater and the corresponding rate of change of critical angle greater than at higher pressures, for the reasons discussed.
Detailed examination
The detailed examination site selection process used a combination of regulatory required sites and additional sites predicted by flow modeling to have a potential for internal corrosion. The company’s written DG-ICDA plan requires a minimum of four sites be selected for first-time assessment. When multiple laterals originating from a common trunkline are combined as a single DG-ICDA region, it recommends selecting detailed examination sites on each of the laterals. This method accounts for variability in gas velocity in each of the laterals and verifies the definition of the entire system as a single ICDA region.
Seven sites in the company’s system were selected for detailed examination:
- The first inclination greater than critical in the first HCA in the DG-ICDA region.
- An inclination location greater than critical in an HCA in the second half of the DG-ICDA region.
- The first critical inclination angle in the DG-ICDA region.
- A drip receiver at the end of line in the first half of the DG-ICDA region.
- A 90° inclination inside the station at a gas purchase point.
- The first inclination in an HCA after a purchase point at the end of the first half of the DG-ICDA region.
- A critical inclination angle near the end of the DG-ICDA region.
Detailed examination at five of the seven selected sites revealed no internal corrosion. B-Scan inspection at Site 6 identified internal metal loss. Evaluation of an additional detailed examination site 50 ft upstream of the original dig location occurred based on potential indications discovered during the inspection screening process. This site identified a field bend with no internal corrosion on the upstream side of the bend and internal metal loss on the downstream side of the bend. B-Scan inspection of the drip at Site 4 also identified internal metal loss.
When metal loss is discovered at detailed examination sites, additional sites must be identified to assess the extent of the affected area and confirm the most severe damage has been found. The project team reviewed the seven sites where direct examination took place and decided, based on internal metal loss identified at Site 4 and Site 6, additional examination sites were necessary.
Site 4 lies at an aboveground pressure vessel with a drip leg at the end of the line. Inspection identified internal metal loss and liquids in the drip leg of the pressure vessel. Subject matter experts noted that about 5 years before inspection, the upstream gas supplier notified the company of a slug of liquids traveling through its line. Station maintenance personnel stated the drip leg had not been drained following this notification. Liquids and internal metal loss identified here are believed to result from a one-time liquid upset from the gas supplier.
Further verification used an additional examination site at a low spot immediately upstream of the pressure vessel. The depth of the line at the location and its proximity to a creek rendered this work unsuccessful. The company instead commissioned an in-line inspection of the line to determine if and to what extent additional metal loss was present.
Subject matter experts verified that before installation of the 12-in. line (1970), flow was high enough to push liquids to the inspection location. As a result, internal metal loss identified at this location is likely historical and not active. Further verification used an additional examination site upstream of Site 6. This site lies immediately after the gas purchase point at the first pipeline inclination angle greater than the calculated critical angle determined by current system flow parameters. Detailed examination of all three parallel lines found no internal metal loss.Site 6 lies at a pipeline inclination angle greater than critical. This site has three parallel lines (4-in., 6-in., and 12-in.) in the pipeline right-of-way. Internal metal loss had occurred on the oldest of the three lines, a 4.5-in diameter line installed in 1952. Current flow conditions made it unlikely liquids would reach this location.
Acknowledgments
The authors thank Piedmont Natural Gas Co. for allowing us to publish this work and Robert Bratcher, Benji Vess, and Martin Boiter for their assistance. Additional thanks go to Steve Biagiotti and Cheryl Janicek for their efforts in making this project a success and to Oliver Moghissi and Jose Vera for insight regarding the modified GRI 02/0057 equation. ¿
References
- Moghissi, O., Norris, L., Dusek, P., Cookingham, B., and Sridhar, N., “Internal Corrosion Direct Assessment of Gas Transmission Pipelines–Methodology,” GRI 02-0057, Gas Research Institute, Des Plaines, Ill., 2002.
- Moghissi, O., Norris, L., Dusek, P., and Cookingham, B., “Internal Corrosion Direct Assessment of Gas Transmission Pipelines,” NACE International CORROSION/2002, Paper 02087, Denver, Apr. 7-11, 2002.
- Moghissi, O., Vera, J., and Norris, L., “Improved Critical Angle Equation Broadening Direct Applicability of ICDA for Normally Dry Natural Gas Pipelines,” NACE International CORROSION/2006, Paper 06183, San Diego, Mar. 12-16, 2006.
