ASSET OPTIMIZATION— Conclusion: Scenarios validate, optimize process
In implementing its field production optimization tool, BP Trinidad & Tobago (BPTT) ran scenarios for tuning, validating, and calibrating the models, as well as multiple optimization scenarios.
This concluding part of a two-part series of articles discusses the scenarios and their results.
Part 1 (OGJ, May 4, 2009, p. 58) covered the software components of the optimization process that includes a library of well models (PROSPER), steady-state field model and optimizer (HYSYS), Excel applications (TFO interface), a data historian (PI), and a BPTT proprietary database (MIRS).
BPTT currently has 11 offshore production platforms feeding into three offshore gas and condensate processing hubs with a 3.75-bscfd capacity.
Four gas pipelines with a 3.525-bscfd combined capacity and one liquid pipeline link the offshore platforms to Trinidad’s east coast.
BPTT has contracts for supplying 2.7-bscfd natural gas to National Gas Co. of Trinidad and Tobago (NGC) and to the Liquefied Natural Gas Co. (Atlantic LNG).
Well model tuning
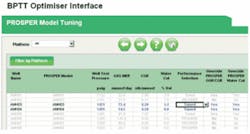
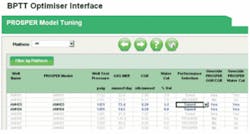
Production and allocation engineers update and calibrate PROSPER well models regularly to reflect actual well performance. The well models are critical to the predictive capability of the asset model; hence the optimization system has specific functions to check well model predictions against the latest well test data and, if necessary, refine model predictions to best match test data (Fig. 1).
For computational efficiency reasons, the process transforms the PROSPER models into polynomial expressions that relate gas flow rate with wellhead pressure. This involves the running of case studies with each PROSPER model and fitting the obtained results to the desired expression.
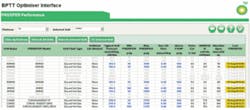
The Trinidad field optimizer (TFO) includes the functions and libraries that carry out this activity (Fig. 2).
Model validation, calibration
Simulation models are a mathematical representation of the physical principles that govern the behavior of a certain process. As such, they are not powerful enough to picture all events that may happen in a real process, especially if due to outside events such as a pipeline blockage. Nevertheless, these are valid operating scenarios, and in fact a field optimizer will demonstrate its value by providing fast and reliable answers on how to operate under those circumstances.
Equipment mechanical degradation is another factor that will affect operations. One cannot model this factor with enough rigor with first-principle engineering models.
For these reasons, equipment models typically include ad hoc adjustable parameters that one can tune to match the actual process performance. The design assumes that these parameters are fixed over a wide range of operating conditions. First-principle model equations continue being valid, but the model results are shifted with an offset calculation to mirror reality.
The values of these calibration factors have themselves an intrinsic value, as they indicate how far the operation is from the physical principles that govern its behavior. An oscillatory pressure drop offset in a gas pipeline may indicate the presence of significant pipeline dynamic effects.
In a gas operation such as BPTT’s, the system hydraulics governed by the gas transportation network from offshore to the coast line and to the processing terminals onshore have a major influence in the operation of the individual platforms as well as in the overall operating margins.
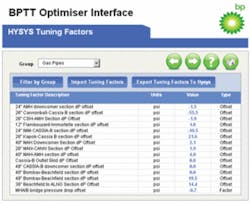
The design takes special care in modeling the pipe networks as accurately as possible and in providing calibration mechanisms that can adjust those models to reflect actual system pressure drops in most scenarios. Fig. 3 shows the model’s adjustable parameters for calibration.
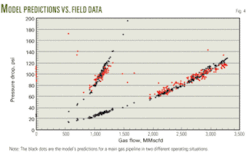
The modeling of the pipeline segments used the Aspen HYSYS built-in pressure drop correlation. The process designers compared and checked these results against field data extracted for prolonged periods of time-on-stream. They used this information to develop empirical models that best fit all data. Each pipeline model has an offset factor that allows fine-tuning of predictions to match actual pipeline pressure readings.
Fig. 4 shows a model’s predictions (black) vs. field data for a main gas pipeline in two different operating situations.
The steady-state field model and optimizer (TFOM) automatically calculates all pipe pressure drop offsets together with other process tuning factors during a calibration step to match field data with the minimal degree of model adjustment.
Pipeline tuning factor values were calculated at relatively different sets of actual process conditions during the testing phase, and important discrepancies were not observed. This indicates that the modeling and calibration approaches employed allow a correct representation of reality within the allowed operating envelopes.
Optimization
As discussed in Part 1, the BPTT gas system operation is constrained and driven by the need of producing the gas quantities contracted with the various gas consumers. Gas deliverability is therefore the key element for BPTT. A multitude of engineering and commercial issues positively or negatively affects deliverability, such as:
- Maintenance activities in platforms.
- Well testing.
- Pipelines pigging.
- Valve failures in pipes.
- Renegotiation of transportation contracts.
- Availability of new gas transportation routes.
The common factor of all these situations is that the asset must keep gas deliverability at required levels in the best possible way with the available system capacity, as well as to react to unexpected events to recover normal production as quickly as possible.
The TFO is a:
- A day-to-day optimizer to guide the operation towards the most profitable way, for example, delivering required gas flow rates while getting the most value out of the associated condensate streams.
- As a what-if optimization system that allows finding the optimum operating strategies when major events occur.
To do so, the HYSYS optimizer’s configuration has enough flexibility to allow operators to specify well status on or off, well pressure and flow rate limits, fixed and swing wells, pipeline availability, and separation equipment availability.
The optimizer also allows for defining the market and commercial information (gas nominations for each consumer, gas values), and the optimization target among a set of preconfigured scenarios.
The set of business scenarios that TFO can execute include:
- Meeting gas nominations while maximizing condensates recovery.
- Finding the maximum attainable operation revenue.
- Finding the maximum attainable gas production.
- Maximizing the value obtained from gas.
- Maximizing the condensates recovery.
- Finding the maximum attainable LNG gas production.
- Finding the maximum attainable gas production for domestic consumption.
Fig. 5 shows the TFO results page that compares field values with optimum set points.
This provides a great level of flexibility to the tool and allows it to address virtually all business concerns and questions that the asset typically faces. It also provides a solid engineering baseline to benchmark individual process engineer’s estimates, which often strongly depend on their particular experience and preferences.
Results
The model of the complete asset was checked against plant data taken during several months. The results of these runs show that the model is in good agreement with the measured plant data. The values of most of the model calibration tuning factors are relatively small, a fact that indicates a good prediction of the asset behavior.
In those cases in which certain tuning factors were unexpectedly high, they were reflecting a true operating issue such as physical restrictions in certain system pipelines or deficient data quality.1 This is a side benefit of the full-field calibrated asset model, which is its ability quickly to spot the areas of the production system where it deviates from the governing engineering principles.
The TFO was used to analyze several real operational scenarios that included:
- Meeting gas demands while maximizing condensates production.
- Unplanned shutdowns of Atlantic LNG trains and optimum strategies to best accommodate the operation to a lower gas demand situation.
- Planned shutdowns of Kapok and Mango wells and the effect on gas deliverability.
- Bringing on a new high yield well, such as in Mango or in Cashima, and analyzing the extra gas production potential.
- Analyzing the extra gas production attained with the Cassia-B Immortelle bypass.
- Simulating a pig blockage of the 40-in. subsea pipeline and its impact on overall gas deliverability.
- Effect of capacity restriction in the 12-in. condensate line on meeting gas market demand.
- Maximum gas deliverability as a function of Atlantic LNG terminal pressure requirements.
Typical use scenario
The main objective of TFO is in helping to meet gas market demands with the maximum associated condensates revenue.
In the most common optimization scenario, the TFO is configured to produce a given set of gas volumes for delivery to multiple gas consumers. The model is first initialized with actual field data, which includes factors such as wellhead pressures, platform pressures, pipeline flows, separator temperatures and pressures, among others.
Upon checking the accuracy of model predictions vs. actual field data or validating the model, the TFO runs will serve to find alternatives for improving how the gas nominations were met during that particular day. TFO will find the optimal gas production distribution among available fixed and swing wells, taking into account the quality and capacity constraints affecting the associated condensate production as well as the back-pressure effects on the gas transportation network that make the operation of the various offshore platforms interdependent.
Preliminary results indicate a potential of 7% more condensate production, equivalent to 1,900 bo/d.
Technology adoption
The successful implementation of optimization technologies such as TFO depends on:
- Having high-level management support.
- Willingness of production engineers and gas dispatchers to adopt it as way for improving existing operating procedures.
BPTT fully endorses both and has set up the necessary frameworks to embed TFO into the production optimization team processes.
Field trial experiments will be used to benchmark the TFO results before the tool is transferred to the gas dispatch team as a control room application.
Acknowledgments
The authors acknowledge Roland Pike and Bryn Stenhouse (BP EPTG Sunbury, UK) for their contribution to the TFO project and Scott Johnston (Ingen-Ideas, Aberdeen, UK) for his support developing the system’s graphical interfaces.
Reference
- Jalilova, N., et al., “Production Optimization in an Oil Producing Asset—The BP Azeri Field Optimizer Case,” SPE Gulf Coast Section Digital Energy Conference and Exhibition, Houston, May 20-21, 2008.
