Weather is always an important influence on propane supply-demand trends during the winter heating season, but the financial crisis and ensuing economic recession had substantial and overriding impact on supply-demand trends during winter 2008-09.
Late last year, we highlighted the impact of Gustav and Ike on gas plants, refineries, and petrochemical plants (OGJ, Nov. 3, 2008, p. 54). We did not know in fall 2008 that the financial crisis would dwarf Gustav and Ike as the most important influence on supply-demand trends for the winter heating season 2008-09. Furthermore, the financial crisis pushed a normal crude oil price correction in July into hypercollapse during the fourth quarter.
This collapse prompted OPEC producers (Saudi Arabia in particular) to make major cuts in crude production. Production cuts in Saudi Arabia reduced associated-gas production and gas plant propane-butane recovery volumes. As the international propane supply-demand balance tightened, waterborne imports into the US became much more expensive.
Propane feedstock demand is an important balancing element for the overall propane market in North America. When colder weather pushes sales and consumption in the retail markets steadily higher, ethylene producers in the Gulf Coast have substantial capability to reduce their consumption and effectively offset some or all of the impact of a colder than normal winter. Historically most of the seasonal decline in ethylene feedstock demand has occurred during fourth quarter. Frequently, feedstock demand for propane rebounds during first quarter.At the end of September, the US had a propane inventory deficit of more than 10 million bbl relative to 2006. Despite this deficit and strong retail demand, inventory levels ended the winter heating season with a year-to-year gain of about 8 million bbl. The sharp decline in feedstock demand was the major factor that catalyzed the swing of 18 million bbl in inventory levels relative to 2006.
Feedstock demand
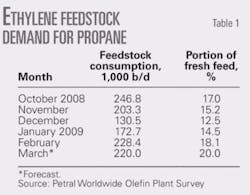
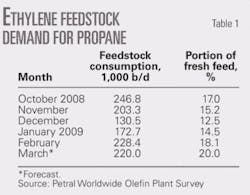
During fourth-quarter 2008, feedstock demand for propane declined by 118,000 b/d vs. consumption during third-quarter 2008 and averaged only 194,000 b/d. While a decline in feedstock demand in the fourth quarter is consistent with seasonal patterns, the decline in 2008 was double the typical decline of 50,000-70,000 b/d. Feedstock demand during fourth-quarter 2008 was 9.7 million bbl less than during fourth-quarter 2007. Propane’s share of fresh feed averaged 14.9% during fourth-quarter 2008 vs. 21.9% during third-quarter 2008 and 17.8% during fourth-quarter 2007.
From a low point of 130,000 b/d in December 2008, feedstock demand for propane rebounded in first-quarter 2009. Demand averaged 165,000-175,000 b/d in January and 225,000-235,000 b/d in February. For full first-quarter 2009, we estimate that demand averaged 210,000-220,000 b/d, or 8.0-8.5 million bbl less than during first-quarter 2008. The cumulative year-to-year decline in feedstock demand was about 16-17 million bbl during the winter heating season. The decline in feedstock demand helped offset low propane inventories and strong demand in retail heating markets.
Table 1 shows trends in ethylene feedstock demand for propane. The deepening economic recession depressed on housing starts during fourth-quarter 2008 and pushed consumer confidence sharply lower. The downturn in housing and consumer spending, in turn, reduced demand for ethylene during fourth-quarter 2008 and first-quarter 2009.
Ethylene producers operated at 67% of capacity in fourth-quarter 2008 and first-quarter 2009. Ethylene producers will operate at 65-75% of capacity during second and third quarters 2009. On this basis, total demand for fresh feed will average 1.25-1.40 million b/d.
Feedstock demand for propane will reach 310,000-330,000 b/d during second and third quarters 2009 and propane’s share of fresh feed will average 21.5-23%. Fig. 1 shows historic trends in ethylene feedstock demand for propane.
Retail demand
Temperatures during fourth-quarter 2008 were colder than in the previous winter for all eastern regional markets. For example, total heating degree-days in the Northeast and mid-Atlantic region were 4.3% and 11.7%, respectively, higher than in 2008. In the upper Midwest during fourth-quarter 2008, heating degree days averaged 9.6% higher than in 2008. Heating degree-days in fourth-quarter 2007 were themselves higher than in fourth-quarter 2006.
We estimate that total retail propane sales averaged 835,000-850,000 b/d in fourth-quarter 2008 or 15,000-35,000 b/d higher than in fourth-quarter 2007. We estimate that total retail propane sales increased to 1.10-1.15 million b/d in first-quarter 2009 or equal to first-quarter 2008.
Propane’s use as a space heating fuel in residential and commercial markets reaches its seasonal peak each year during fourth and first quarters. Residential and commercial propane demand begins to increase during September and October and usually reaches peak demand during December and January.Based on actual demand data for 2007, conservation effects partially offset the impact of colder weather. We accounted for continued conservation efforts in making estimates for retail during for winter 2008-09. On this basis, retail demand during the winter heating season totaled 175-180 million bbl, or about 5 million bbl more than during the previous winter.
Propane supply
Propane prices fell sharply in concert with the collapse in crude oil prices. Natural gas prices also declined during fourth-quarter 2008 but not as sharply as propane prices. Consequently, profit margins for propane recovery from gas processing plants were sharply lower in fourth-quarter 2008 and first-quarter 2009 compared with those for third-quarter 2008. Propane recovery, however, remained very profitable. In most regions, propane recovery margins were double the prevailing levels of 2003-05.
For refineries, economic incentives to move propane into the merchant market also remained strong. Propane prices averaged $8.00-8.75/MMbtu, or $3-5/MMbtu higher than natural gas prices during fourth-quarter 2008. Refineries had no incentive to burn propane instead of natural gas during the winter heating season. Refineries in the upper Texas Coast, however, did not fully recover from hurricane-related downtime until late in fourth-quarter 2008. This factor limited refinery propane supply.
Data published by the US Energy Information Administration indicate that total domestic production from gas plants and net propane production from refineries averaged 803,000 b/d, or 48,000 b/d (4.5 million bbl) lower than year earlier production volumes. We expect domestic production averaged 865,000-875,000 b/d during first and second quarters 2008. These volumes compare favorably with 857,000 b/d of total domestic production during second-quarter 2008.
For the winter 2008-09, domestic propane production totaled about 152 million bbl, or 1 million bbl less than during the previous winter heating season.
Gas plants
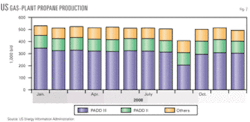
EIA statistics indicate that gas plant propane production averaged 499,000 b/d for fourth-quarter 2008 and was 21,000 b/d lower than year earlier volumes. Hurricane-related natural gas curtailments in the Gulf of Mexico and ethane rejection reduced gas plant propane production in Louisiana by 25,000 b/d vs. year earlier volumes.
Similarly, gas plant production in Texas and New Mexico was 10,000 b/d lower than in fourth-quarter 2007—primarily due to extensive ethane rejection and associated propane production losses during November and December. Production in the Rocky Mountains during fourth-quarter 2008, however, posted a year-to-year increase of 10,000 b/d.
We expect gas plant production to average 530,000-550,000 b/d in first and second quarters 2009. Fig. 2 shows trends in propane production from gas plants.
Refineries
In fourth-quarter 2008, propane production from refineries (net of propylene for propylene chemicals markets) averaged 304,000 b/d—an increase of 5,000 b/d from net refinery supply in third-quarter 2008 but a decline of 27,000 b/d vs. year earlier volumes, according to EIA statistics.
Consistent with hurricane-related outages, net refinery propane production during fourth-quarter 2008 was at its lowest level in October 2008 and averaged only 290,000 b/d. Production was higher in November and December 2008, but remained below second-quarter 2008 average of 327,000 b/d.
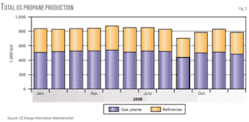
We expect propane supply from refineries to average 325,000-335,000 b/d in first and second quarters 2009. Fig. 3 shows trends in total propane production (gas plants and refineries).
Imports
Data from the Census Bureau-Foreign Trade Division show that propane imports from Canada increased in fourth-quarter 2008 and averaged 134,000 b/d in fourth-quarter 2008, or 5,000 b/d lower than year earlier volumes and 38,000 b/d below the average for 2000-05. We estimate that propane imports from Canada increased to 170,000-180,000 b/d in first-quarter 2008.
Consistent with seasonal supply trends, international imports declined during fourth-quarter 2008, as reported by the Census Bureau-Foreign Trade Division, and averaged only 39,000 b/d. International imports were 20,000 b/d fewer than year earlier volumes during fourth-quarter 2008. Prices in the Northeast US, however, increased sharply in January and February 2009.
The jump in prices attracted a surge in waterborne shipments into East Coast import terminals. We estimate that waterborne imports alone averaged 50,000-60,000 b/d in first-quarter 2009.
Inventory trends
Nov. 1 normally marks the beginning of the inventory liquidation season for the US. Occasionally, however, propane inventories reach their seasonal peak in mid to late November. In fourth-quarter 2008, propane inventory in primary storage reached its seasonal peak of 57 million bbl (excluding non-fuel propylene) during the second week of November.
For North America overall, inventories reached a seasonal peak of 70.7 million bbl at the end of September, or 2.9 million bbl lower than the inventory peak in 2007. Even though hurricane-related problems reduced total domestic production by 4.5 million bbl in fourth-quarter 2008 and by 2.5 million bbl during December alone, inventories of purity propane totaled 51.8 million bbl, or 1.77 million bbl more than year earlier volumes. The weakness in ethylene feedstock demand during fourth-quarter 2008 was enough to offset lower domestic production.
Consistent with the seasonal increase in retail propane sales, propane imports from Canada typically increase to peak seasonal volumes of 150,000-175,000 b/d during fourth quarter and 170,000-190,000 b/d during first quarter. Additionally, propane imports from international sources (outside North America) usually decline sharply during fourth quarter. Imports from international sources typically remain at seasonally minimum levels during first quarter.During a typical winter, propane markets pull 40-44 million bbl of inventory from primary storage. Weekly inventory reports from the EIA showed that inventories of purity propane declined by only 25 million bbl during first-quarter 2009 and by 33 million bbl for the full winter heating season.
The weakness in ethylene feedstock demand was enough to offset lower domestic production during fourth-quarter 2008. The surge in waterborne imports into East Coast terminals during first quarter helped to minimize the impact of colder than average temperatures and strong retail heating demand.
Purity propane in primary inventory in Canada totaled only 8.9 million bbl on Sept. 1, 2008, or 1.2 million bbl fewer than year earlier volumes and 1.6 million bbl fewer than the 5-year average. Statistics from Canada’s National Energy Board showed that Canadian companies withdrew 7.6-8.0 million bbl of propane from primary storage during the winter heating season.
Inventories of purity propane fell to a seasonal low of 1.1-1.3 million bbl at the end of March 2008. Purity propane inventories in Canada were 2.0 million bbl lower than the 5-year average and 1.2 million bbl lower than year earlier levels at the end of March.
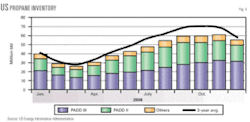
Fig. 4 presents trends in propane inventory.
Regional inventory trends
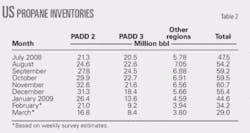
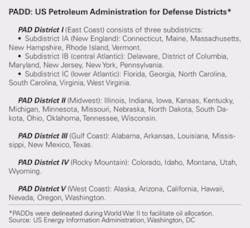
Propane inventory in primary storage in US Petroleum Administration for Defense District (PADD) II peaked during the second week of October 2008 and totaled 25.3 million bbl, or 1.7 million bbl more than peak inventory in 2007 and 1.3 million bbl higher than the average for 2002-06. By the end of February 2009, inventory in primary storage in PADD II declined to 12.5 million bbl and was 3.3 million bbl lower than the 5-year average.
During March 2009, however, EIA’s weekly reports indicate that inventories in PADD II increased by 300,000-500,000 bbl and ended the winter heating season at about 13.0 million bbl, or about 2 million bbl higher than the 5-year average.
Propane inventory in primary storage in PADD III (excluding nonfuel propylene) reached its peak during the first week of December 2008 (about 2 months later than in PADD II) and totaled 29.7 million bbl, or 1 million bbl more than the peak inventory level of 2008. The record high inventory for PADD III for the first week of December was 36.6 million bbl (December 2005).
By the end of January 2009, inventory in primary storage in PADD III declined to 24.1 million bbl, or 7 million bbl higher than in 2008. Withdrawals of inventory remained at typical levels during February and March, and inventories fell to a seasonal low of 17.0-17.5 million bbl at the end of March 2009—a year-to-year increase of 5.0-5.5 million bbl.
Pricing, economics
Although the hypercollapse in crude oil prices was the dominant influence on propane price trends, ethylene feedstock parity values and unusually weak feedstock demand were the dominant influence on propane price relationships vs. other NGLs during fourth-quarter 2008.
At the beginning of the heating season, propane prices in Mont Belvieu averaged 103.5¢/gal in October 2008 and were 37% lower than the August average of 165.2¢/gal. During the period of falling spot prices, propane’s ratio vs. West Texas Intermediate declined to 56.8% in October 2008 and 54.0% in November 2008 vs. 62.1% in September 2008.
For third-quarter 2008, propane prices averaged 168¢/gal and feedstock parity values vs. light naphthas averaged 181.6¢/gal. In fourth-quarter 2008, propane prices averaged 79.4¢/gal and feedstock parity values vs. light naphthas averaged 77.7¢/gal. These comparisons indicate that the impact of the economic recession on ethylene feedstock demand reinforced the generally bearish impact of the collapse in West Texas Intermediate prices on propane prices as well as prices for other ethylene feedstocks during third and fourth quarters 2008.
The decline in WTI prices accelerated during November and December 2008. Propane prices fell more sharply than did WTI prices during November and continued to decline during December 2008. Propane prices, however, were equal to 61.7% of WTI in December 2008, or 14% stronger than in November 2008. The shift to colder than average temperatures and the surge in propane transfers from Mont Belvieu to the northeastern retail markets were strong bullish influences and counterbalanced the bearish of very weak feedstock demand.
As the frenzied scramble for propane supply in northeastern retail markets reached its peak in January 2009, spot prices in Mont Belvieu increased to 72.6¢/gal and were equal to 73.0% of WTI. Average postings in the Northeast, however, jumped to 87-88¢/gal in January. In view of the 8¢/gal pipeline tariff from Mont Belvieu to Selkirk, NY, prices in Mont Belvieu could have been even higher in January, but weak feedstock demand counterbalanced strong demand in the Northeast retail heating market.
In February 2008, supply concerns in the Northeast retail markets began to abate. As a result, spot prices in Mont Belvieu declined by 7.2¢/gal and the propane-WTI price ratio declined to 70.2%. An overdue rally in WTI prices began in late February and extended through the end of March. Despite the rally in crude oil prices, spot propane prices in Mont Belvieu averaged only 65¢/gal in March and were equal to 57.8% of WTI.
Spring, summer prices
We view the crude oil price rally during February-March 2009 to be an overdue correction. As a result, WTI prices will average $45-55/bbl during second and third quarters 2009. Spot ethane prices, however, are likely to remain relatively weak and will continue to undermine propane’s value in at least 40% of the ethylene feedstock market.
Spot propane prices in Mont Belvieu will weaken during second quarter and will average 62-64¢/gal. Prices will remain in this range during third-quarter 2009. Feedstock parity values vs. ethane will decline to 52-55¢/gal during second and third quarters 2009. Feedstock parity values vs. light naphthas will average 65-75¢/gal during second and third quarters 2009.
The economic incentive to crack propane rather than light naphthas will average 4-8¢/gal. The disincentive to crack propane relative to ethane, however, will average 8-10¢/gal. The propane-WTI ratio will average 56-60% during second and third quarters 2009.
The author
Daniel L. Lippe ([email protected]) is president of Petral-Worldwide Inc., Houston. He founded Petral Consulting Co. in 1988 and cofounded Petral Worldwide in 1993. He has expertise in economic analysis of a broad spectrum of petroleum products including crude oil and refined products, natural gas, natural gas liquids, other ethylene feedstocks, and primary petrochemicals. Lippe began his professional career in 1974 with Diamond Shamrock Chemical Co., moved into professional consulting in 1979, and has served petroleum, midstream, and petrochemical industry clients since that time. He holds a BS (1974) in chemical engineering from Texas A&M University and an MBA (1981) from Houston Baptist University. He is an active member of the Gas Processors Association, serving on the NGL Market Information Committee and currently serving as vice-chairman of the committee.
