HYDRAULIC FRACTURING— Conclusion: Additional keys give stimulation insights
Four keys provide a way for understanding, modeling, and predicting shear stimulation and its benefits in naturally fractured reservoirs.
The first part of this two-part series (OGJ, Mar. 23, 2009, p. 37) discussed the complex geometries formed and the first key, while the concluding part will cover the remaining three keys.
Second key
The second key relates to understanding the flow dominated by natural or induced fractures. Warpinski did the pioneering work on this topic and Reference 1 contains summary statements in regard to the pressure distribution away from a central fracture plane, as follows:
- “For gas reservoirs, the leak off into the matrix is very small and seldom exceeds a few tens of feet. In these reservoirs, leak off into the natural fractures is the important issue, as it can result in fracturing fluid moving an order of magnitude greater distance from the fracture.”
- “For a porous medium, the porosity and permeability are that of the matrix. For natural fractures, the permeability and porosity are those of the natural fractures and the matrix effect is ignored.”
This distinction between fracture-dominated flow and matrix-dominated flow is critical. For example, the pressure transient that spreads through the reservoir during a fracture treatment is the usual cause of any shear failure.1 2 For fracture-dominated flow, the pressure transient can spread much faster and farther than via a matrix without fractures.
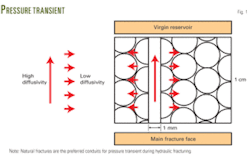
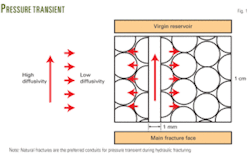
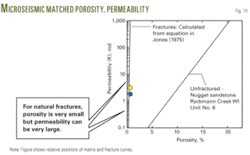
The natural fractures are preferred conduits for pressure transient during a fracture treatment (Fig. 1). Even though fracture porosity is normally <0.5%, permeability can be high: 0.1-1,000 md.3 The higher value of fracture permeability and lower value of fracture porosity imply that even tight gas reservoirs can have very high diffusivity, and this determines the rate of pore pressure diffusion through the reservoir.
If the treatment creates a hydraulic fracture with cross-linked gel, the cloud of microseismic bursts is much smaller than when the job uses slick water. The difference is that with cross-linked gel formation of an impermeable filter cake follows the spurt loss at natural fractures. The filter cake prevents pressure transmission along the natural fractures, thereby inhibiting shear failure.
With slick water, however, very little or no filter cake forms. Water or gas inside natural fractures transmits pressure and may cause shear failure.
Note that during injection, the fracture permeability is not only virgin fracture permeability but also could include ballooning of fractures plus any permeability enhancement due to shear or tensile failure. This is the lumped model that we use.
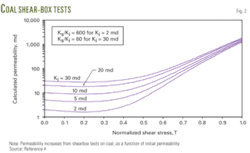
Our concept is that there is a strike-slip synergism between pore-pressure diffusion and shear failure. That is, at the start, the pressure transient spreads along a natural fracture and at some point becomes high enough to induce shear failure. When that happens, the permeability over some fracture length increases through dilatancy (Fig. 2),4 and this allows the pressure to spread faster and further.
This can explain how shear failure and microseismic bursts occur at unexpectedly large distances.
An alternative explanation, offered by Barree,5 is that formation compression resulting from an inflated central fracture induces shear failure. Bedding planes that separate lithologies with different mechanical properties will exacerbate the shear failure.
Natural fractures also are preferred conduits for leak off during a fracture treatment. This implies that fracture porosity determines initial depth of leak-off invasion, not matrix porosity.
Third key
Barree and coworkers over many years have explored in depth the next key to shear stimulation, which is understanding pressure-dependent leak off in natural and induced fractures.6 7
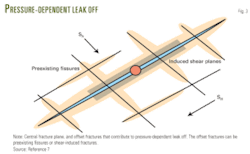
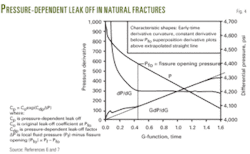
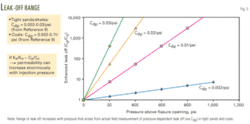
The idea is that offset fractures can open under pressure during a hydraulic fracture treatment and contribute to the leak off (Fig. 3). But more than this, as pressure increases, the widths of the offset fractures increase and the leak off increases exponentially (Fig. 4). This can have dire consequences, including frac treatment screen out.
The signature of pressure-dependent leak off (PDL) lies in a plot of GdP/dG vs. G, where G is a function of dimensionless time as defined by Nolte,8 and can be differentiated from other effects such as fracture extension after shut-in, fracture compliance, and fracture height recession.6 7
The PDL factor, Cdp, in the exponential leak-off formulation of Fig. 4 must closely relate to pressure-dependent permeability (PDP) in natural fractures, which one also usually models with an exponential function of pressure change.
If we assume they are of the same order, this conceptually allows us to input PDL to models for matching microseismic burst patterns, which require an enhanced permeability during injection. This connection, which other modelers seem to have overlooked, is why we regard PDL as a key to shear stimulation.
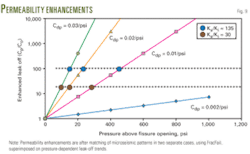
To take this a step further, Fig. 5 illustrates the large increases in leak off with pressure that correspond to actual ranges of Cdp inferred from field measurements of PDL in tight sands.9 Now if we assume that permeability increases are of the same order, it is clear that permeability can increase enormously with injection pressure, for example by 10-1,000 times.
This ties in well with enhanced permeability measured in lab tests, as illustrated in coals (Fig. 2).
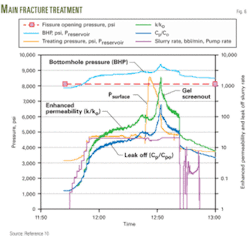
A direct consequence of this is that we can track increases in fracture permeability (natural or induced) if we know bottomhole pressure during a fracture treatment. To illustrate, in one case the offset fracture permeability increased by about 100 times, based on measured PDL, just before a screen out (Fig. 6).10 We have inferred even larger permeability increases in other cases.
The critical insight is that one should input PDL to any modeling prediction of shear stimulation. One can use a measurement of PDL during prefracture tests, such as diagnostic fracture injection tests (DFITs) or minifracs to obtain a Cdp factor for input into the model.
We have done this in one case in which we matched microseismic burst patterns, as follows:
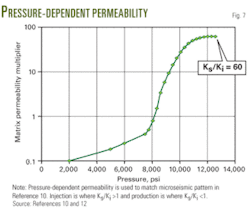
One modeling approach assumes a pressure-dependent permeability function (for natural or induced fractures) and uses this as a variable parameter to match both microseismic burst pattern and well production.11 12Fig. 7 shows one such function, where the pressure-dependent permeability increase during injection reaches about 60 times.
Another such function gives a permeability increase of 667 times for a pressure increase of only 81 psi.11 Note, this increase would include permeability enhancement due to shearing plus other mechanisms such as ballooning of fractures or tensile failure. This lumped approach is also the approach we have used in our modeling discussed in the following section.
In summary, the role of fracture-dominated pressure-dependent leak off in shear stimulation is as follows:
- It has the same order-of-magnitude as pressure-dependent permeability (actual pressure-dependent permeability can be up to 10 times larger).
- Permeability increases due to PDL can be very large during fracture treatments (exceeding 100 times) because the mechanism is fracture-dominated (natural or shear-induced fractures).
- It allows the pressure increase to travel through the formation faster and further. This is needed to match microseismic data.11 12
- On balance, there is a big difference between injection permeability and production permeability (Fig. 7). Pressure-dependent permeability is generally smaller during production and depletion in hard rock because of cement in natural fractures.13
- A lumped pressure-dependent permeability during injection would include permeability enhancement due to shearing as well as ballooning of fractures and tensile failure.
Fourth key
The fourth key involves matching microseismic patterns because shear failure directly causes microseismic bursts. Again, it was Warpinski who recognized this as a key and documented a detailed effort to model and match observed microseismic burst patterns.1 14 There are two extremes of modeling to match microseismic observations:
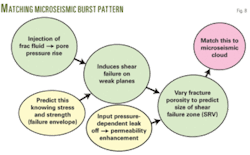
Fig. 8 summarizes our in-house screening model, FracFail, which is similar to earlier approaches.1 As pore pressure diffuses away from the central fracture plane throughout the reservoir, it induces shear failure out to some distance, which one can predict from in situ stresses and rock strengths.
The spread of the pore pressure depends on the fracture-dominated permeability and porosity, as explained earlier. In an ideal case, we would extract the fracture permeability from pressure-dependent leak-off measurements, and this leaves the fracture porosity as a free parameter.
Although this is only a screening model, it captures the keys to shear stimulation, and the modeling results appear to reflect the important physics. More sophisticated models require more input parameters and usually take a long time to run (many hours). Our model, after initial set up, runs in less than 1 min.
It can match quickly a pattern of microseismic data and do sensitivity studies that reveal what inputs are most important and, therefore, need careful measurement. We envision that the model will be used for designing a shear stimulation in a real well because it can run different scenarios quickly.
To illustrate some differences between the screening and sophisticated models, the more sophisticated model of Reference 16 includes both shear and tensile failure, injection above or below parting pressure, and prediction of permeability enhancement from first principles. Nevertheless, permeability increases with normalized injection pressure are of the same order as found with our screening model.2
Finally, we matched two microseismic burst patterns in separate fields,10 and the results are captured in Fig. 9. The permeability enhancements obtained from the matching vary from 30 times to 135 times. They appear consistent with higher pressure-dependent leak-off values from the general range in tight gas plays9 of Cdp = 0.002-0.03/psi that appear as straight lines. Note: We assume in Fig. 9 that pressure-dependent leak off is of the same order as pressure-dependent permeability.
The microseismic matching results also are consistent with the general characterization of natural fractures (Fig. 10)3 because the matching porosities we obtained are very low (<1%). Although this does not prove the matching results are correct quantitatively (more work will need to verify this), it does indicate some self-consistency in our model and results.
Note, in one modeling case in Fig. 9, we actually input permeability enhancement obtained from a pressure-dependent leak-off measurement in the same well, and this is recommended in future matching of microseismic burst patterns.
Permeability retention
All the previous discussion has focused on shear failure and enhanced permeability during fluid injection, such as a fracture treatment. The permeability increases can be very large, especially in hard rock. When pore pressure, however, dissipates after completion of the injection, the enhanced permeability may dissipate also, as discussed in other references.18
How much enhanced permeability remains is difficult to predict, and some information suggests that the formation may lose a large proportion of the shear-enhanced permeability. Fig, 7 implies that none of the enhanced permeability remains when a well goes on production.
The hope, however, is that one can mitigate the permeability loss by creative design of proppant injection to prop open the natural or induced fractures before they close.
Acknowledgments
This work was supported by a project for BPAmerica. We thank BPAmerica for permission to publish this article.
References
- Warpinski, N., “Analysis and prediction of microseismicity induced by hydraulic fracturing,” Paper No. SPE 87673, SPE Journal, March 2004, p. 24.
- Palmer, I., et al., “Modeling shear failure and stimulation of the Barnett shale after hydraulic fracturing,” Paper No. SPE 106113, SPE Hydraulic Fracture Conference, College Station, Tex., Jan. 29-31, 2007.
- Nelson, E., et al., “Using geological information to optimize stimulation practices in the Cooper Basin, Australia,” Petroleum Geoscience, Vol. 13, No. 1, February 2007.
- “Cavity completions for enhanced coalbed methane recovery,” TerraTek, GRI-95/0432, June 1996, pp. 6-1 to 7-3 and E-1 to E-11.
- Barree, R.; personal communication, 2007.
- Barree, R., and Mukherjee, H., “Determination of pressure dependent leakoff and its effect on fracture geometry,” Paper No. SPE 36424, SPE ATCE Denver, Oct. 6-9, 1996.
- Barree, R., “Applications of pre-frac injection/falloff tests in fissured reservoirs—field examples,” Paper No. SPE 39932, Rocky Mountain Regional/Low-Permeability Symposium, Denver, Apr. 5-8, 1998.
- Nolte, K.G., and Smith, M.B., “Interpretation of Fracturing Pressures,” Paper No. SPE 8297, SPE ATCE, Las Vegas, Sept. 23-26, 1979.
- Ramurthy, Kumar, personal communication, 2007.
- Palmer, I., “Geomechanics of shear stimulation,” Tight Gas Completions: Technology Applications and Best Practices, SPE ATW Keystone, Colo., Dec. 12-14, 2007
- Ji, L., et al., “A new approach to hydraulic fracture modeling—fully coupled with geomechanical and reservoir simulation,” Paper No. SPE 99428, Europec/EAGE Conference, Vienna, June 12-15, 2006.
- Settari, A., et al.: “The modeling of the effect of water blockage and geomechanics in waterfracs,” Paper No. SPE 77600, SPE ATCE, San Antonio, Sept. 22-Oct. 2, 2002.
- Reiss, L.H., The Reservoir Engineering Aspects of Fractured Formations, Institut Francais du Petrole Publications and Gulf Publishing Co., Houston, 1980.
- Warpinski, N.R., et al., “Analysis and prediction of microseismicity induced by hydraulic fracturing,” SPE Paper No. SPE 71649, SPE ATCE, New Orleans, Sept. 30-Oct. 3, 2001.
- Wold, M., et al., “Cavity completion for coalbed methane stimulation—an integrated investigation and trial in the Bowen basin, Queensland,” Paper No. SPE 30733, ATCE, Dallas, Oct. 22-25, 1995.
- Rahman, M.K., et al., “A shear-dilation-based model for evaluation of hydraulically stimulated naturally fractured reservoirs,” Intl. J. Num. & Anal. Methods Geomec., Vol. 26, 2002, pp. 469-97.
- Kleiner, S., et al., “Multiple fracture modeling with discrete element models (DEM),” CEA: Tight Gas & Unconventional Resource Fracturing Symposium, Houston, Oct. 24-25, 2007.
- Chipperfield, S., et al., “Shear dilation diagnostics: a new approach for evaluating tight gas stimulation treatments,” Paper No. SPE 106289, SPE Hydraulic Fracturing Technology Conference, College Station, Tex., Jan. 29-31, 2007.
