A pattern recognition-based anomaly detection system for bottomhole assemblies can determine whether the tools in the BHA are operating in a nominal or degraded mode.
The developed system has demonstrated that it can detect faults in a rotating steering system tool and can provide about 16 hr of warning before tool failure. Furthermore, in a demonstration, the system detected about 94% of the faults present in a collection of runs known to contain steering system faults.
As the costs of rig downtime continue to increase, it is becoming increasingly important to mitigate or prevent downhole failures. In its present state, the described system enables faster root-cause analysis at maintenance facilities and in the field. In the near future, plans include distribution of the system to workshops and rigs so that they can make more accurate operations and maintenance decisions, such as the prevention of rerunning faulted tools.
These applications provide monetary savings for both service providers and rig operators.
Need for system
Modern drilling equipment operates in increasingly severe environments, with downhole temperatures exceeding 200° C. and high-impact vibration events being common. Additionally, rig operators are asking tools to perform mission profiles that previously were impossible, thereby increasing the stress on the downhole tools. All the while, customers have started to demand in contracts a high reliability to help them prevent costly downhole failures and ensure profitability.
The current periodic maintenance practices have proven insufficient or cost intensive to meet these new challenges.
Because of this, industry is shifting toward simple condition-based maintenance approaches, which use design guidelines and rough operational thresholds to assess individual tool health. While this approach has value, there is a large amount of tool performance and environmental data collected during operations that companies have yet to incorporate effectively into the health assessment process.
This article presents a new, empirical model-based approach for detecting faults before failure in components of BHA tools. One can describe this approach briefly as using real-world examples of good runs to establish a statistical definition of unfaulted tool operation. To determine whether another tool operates normally, a statistical test determines if the tool operates in a nominal mode, in which the statistics are similar to unfaulted behavior, or degraded mode, in which the statistics differ from unfaulted behavior.
In this way, one can assess tool health based on its actual performance, as compared with its expected performance for quantized environmental factors such as:
- Elevated static loads such as bending.
- Dynamic loads such as lateral vibration.
- The combination of static and dynamic loads.
Operational data collected from a rotating steering system tool demonstrates this approach. The developed system will allow service providers to make more agile maintenance decisions and provide operators the means to incorporate reliability into the well planning and operations processes, enabling monetary savings for both parties.
Anomaly detection
The goal in fault or anomaly detection is to detect subtle changes in process parameters beyond those normally expected. The petroleum industry has restricted the field of anomaly detection to the problem of monitoring mud flow for well control.1-6
These particular applications have the objective of detecting anomalies in mud flow to help operators prevent various problems, such as the occurrences of kicks, loss of circulation, and degradation of pump efficiency. These problems could lead potentially to costly rig downtime.
The historical development of the previously described kick-detection systems has two features that are of interest in development of anomaly detection systems that closely mirror those of other industries, such as the nuclear7-9 and computing industries.10 11
First, most implement a three-step process for anomaly detection:
Second, there is an increasing gravitation toward empirical models, as compared with physical models because empirical models often are more accurate and malleable for real-world applications.
The work discussed in this article uses the previously described three-step anomaly detection process (predict, calculate residuals, and detect) and purely data-driven algorithms to predict and detect tasks. This work also is, to the authors’ knowledge, the first implementation of an anomaly detection system for BHA tools.
The system described in the next section demonstrates its application for detecting anomalies in a rotating steering system (RSS) using real-world data.
Method
As described in the previous section, the anomaly detection process has three major steps. The following hypothetical example provides more details on the process.
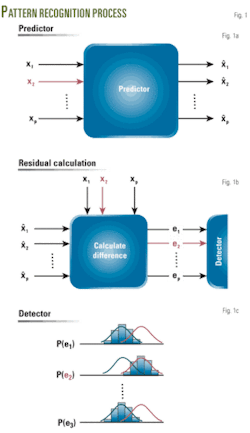
As depicted in Fig. 1, suppose that we have trained a predictor to estimate p signals based on their healthy correlations and we have trained a detector to recognize the distributions of the estimate residuals for healthy observations. For this example, let us suppose that a fault in the system has caused the second signal (denoted by x2) to deviate from its healthy behavior.
The first step in the process passes the p observed signals to the predictor that produces estimates of the signals based on their healthy correlations (Fig. 1a). Because training of the predictor used unfaulted data, the estimates will lie near to the expected values if no fault occurred in the system.
Next, we quantify the difference between the observations and estimates by calculating the residuals (Fig. 1b). Since the second signal deviates from its healthy behavior, we can expect the second residual (e2) to have a different distribution than that of its healthy counterparts.
Once we have calculated the residuals, we pass them to the detector, where we use a statistical test to detect slight deviations (Fig. 1c). The detector compares the observed probability distribution of the estimated residuals (denoted by gray rectangles) to a nominal (black dashed line) and degraded modes (red dashed line), only one of which is presented in Fig. 1c.
In the figure, we can see that the distributions of the residuals for the first and pth signal lie close to the nominal mode. In these cases, the detector would conclude that healthy distributions more likely had generated the residuals; therefore, the detector would deem these signals as healthy.
This is not the case for the second residual. Notice that the observed distribution lies near the degraded mode. In this case, the detector would deem that the second signal does not represent healthy behavior, and it would raise an alarm.
This work uses the nonparametric fuzzy inference system (NFIS)12 to predict the signal values and the sequential probability ratio test (SPRT)13 to differentiate between nominal and degraded modes. A detailed description of these algorithms is beyond the scope of this article, but a reader can obtain addition information from References 12 and 13.
Operations
To demonstrate the previously described system, a study used it to detect faults in the hydraulic units of a rotating steering system (RSS). The study selected the RSS based on its high failure costs to rig operations and critical influence on overall BHA reliability.14 15 In the system studied, three hydraulic units exert pressure on the borehole wall to steer the BHA in the desired direction.
The system first trained a NFIS predictor and SPRT detector on three signals collected from three hydraulic ribs: pressure, electrical motor current, and motor rpm. To complete the training, the system algorithmically chose exemplar observations of the selected signals from the memory dump data collected from more than 100 good runs.
In the next step, the system calibrated the detector by calculating the mean and variance of the predictor residuals for all good data. It also calculated the values of the mean shifts from the data by setting Mi to be 3σi, where σi is the standard deviation of the ith nominal distribution.
It is important to note that the system performed this entire training procedure automatically. In fact, the automation is to the extent that the system updates the predictors and detectors daily, continuously integrating additional data as they become available.
The trained system then detected faults in a memory dump collected from real-world operations that contained a known. In this case, the fault is mud intrusion, where mud enters the hydraulics of the ribs and eventually leads to complete unit failure.
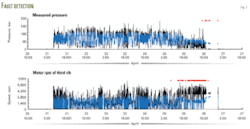
Fig. 2 shows the detected measured pressure and the motor rpm. In the figure, the observed values are black, the NFIS estimates are blue, and the alarms are red Xs.
The figure indicates that the hydraulic unit failed on Apr. 26 at 10:00, in that the unit no longer can build the required pressure. At that point, one can see that the system has generated numerous alarms.
Next, examining the rpm signal reveals a pronounced change in the level of the rpm as compared with the NFIS estimates. More specifically, for the observed pressure, the NFIS estimates a lower rpm, which agrees with nominal system behavior. Notice, however, that the rpm is not low but slightly higher than its estimates.
From the alarms, one can see that on Apr. 25 at 18:00, the rpm begins abnormal behavior. At this point, mud begins to enter the hydraulic system, resulting in a more viscous fluid. As a result, the motor must work harder to build pressure in the unit, which produces the observed change in correlations that the anomaly detection system senses.
In this case, one can see that the unit can build pressure for about 16 hr before the unit fails.
Now that this example has demonstrated the system performance for an individual run, it is important to take a step back and evaluate its performance during many runs that are representative of different operating conditions and failure modes.
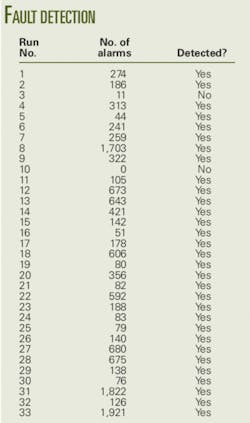
To do this, the system evaluated 33 runs with validated RSS faults (see table). The system bases its decision on the number and extent of the alarms.
The results show that the system detected faults in 31 of the 33 runs for a detection sensitivity of about 94%. These results indicate that the developed approach is robust enough to detect reliably and accurately anomalies in the RSS.
References
- Lloyd, G.M., et al., “Practical Application of Real-Time Expert System for Automatic Well Control,” Paper No. IADC/SPE 19919, IADC/SPE Drilling Conference, Houston, Feb. 27-Mar. 2, 1990.
- Milner, G.M., “Real-Time Well Control Advisor,” Paper No. SPE 24576, SPE ATCE, Washington, DC, Oct. 4-7, 1992.
- Harmse, J.E., et al., “Automatic Detection and Diagnosis of Problems in Drilling Geothermal Wells,” Geothermal Resources Council, Vol. 21, October 1997.
- Mansure, A.J., et al., “A Probabilistic Reasoning Tool for Circulation Monitoring Based on Flow Measurements,” Paper No. SPE 56634, SPE ATCE, Houston, Oct. 3-6, 1999.
- Hargreaves, D., et al., “Early Detection for Deepwater Drilling: New Probabilistic Methods Applied in the Field,” Paper No. SPE 71369, SPE ATCE, New Orleans, Sept. 30-Oct. 3, 2001.
- Nybo, R., et al., “Spotting a False Alarm—Integrating Experience and Real-Time Analysis with Artificial Intelligence,” Paper No. SPE 112212, SPE Intelligent Energy Conference and Exhibition, Amsterdam, Feb. 25-27, 2008.
- Singer, R.M., et al., “A Pattern-Recognition-Based, Fault-Tolerant Monitoring and Diagnostic Technique,” Proceedings of the 7th Symposium on Nuclear Reactor Surveillance and Diagnostics, Avignon, France, June 19-23, 1995.
- Xu, X., et al., “Sensor Validation and Fault Detection Using Neural Networks,” Proceedings of the Maintenance and Reliability Conference, Gatlinburg, Tenn., May 10-12, 1999.
- Gribok, A.V., et al., “Use of Kernel Based Techniques for Sensor Validation in Nuclear Power Plants,” Statistical Data Mining and Knowledge Discovery, Chapman and Hall/CRC Press, 2004.
- Gross, K.C., et al., “Proactive Detection of Software Aging Mechanisms in Performance Critical Computers,” Proceedings of the 27th Annual NASA Goddard Software Engineering Workshop, 2002.
- Whisnant, K., et al., “Proactive Fault Monitoring in Enterprise Servers,” Proceedings of the International Conference on Computer Design, Las Vegas, June 27-30, 2005.
- Garvey, D.R., “An Integrated Fuzzy Inference Based Monitoring, Diagnostic, and Prognostic System,” PhD dissertation, Nuclear Engineering Department, University of Tennessee, Knoxville, December 2006.
- Wald, A., Sequential Analysis, New York: John Wiley & Sons, 1947.
- Wand, P., et al., “Risk-Based Reliability Engineering Enables Improved Rotary-Steerable-System Performance and Defines New Industry Performance Metrics,” Paper No. IADC/SPE 98150, IADC/SPE Drilling Conference, Miami, Feb. 21-23, 2006.
- Brehme, J., and Travis, J.T., “Total BHA Reliability—An Improved Method to Measure Success,” Paper No. IADC/SPE 112644, IADC/SPE Drilling Conference, Orlando, Mar. 4-6, 2008.
The authors
Dustin R. Garvey ([email protected]) is a diagnostics and prognostics team lead at Baker Hughes, Celle, Germany. His research areas include developing data-driven fault detection, diagnosis, and prognosis system for drilling systems. Garvey received his BS, MS, and PhD in nuclear engineering from the University of Tennessee.
Jorg Lehr is a product reliability engineering manager at Baker Hughes, Celle, Germany. He has worked as a design engineer and reliability engineer for Baker Hughes since 1991. Lehr has an MS in mechanical engineering.
Jorg Baumann is director of global reliability and fleet management for Baker Hughes, Celle, Germany. He has worked for Baker Hughes in various engineering and management roles since 1988. Baumann has an MS in mechanical engineering.
J. Wesley Hines is a professor of nuclear engineering at the University of Tennessee, Knoxville, and currently is on loan to the College of Engineering as the interim associate dean for research and technology. He teaches and conducts research in artificial intelligence and advanced statistical techniques applied to process diagnostics, condition-based maintenance, and prognostics. Hines has a BS in electrical engineering, an MBA, and an MS and a PhD in nuclear engineering from Ohio State University.
