Nongas-phase hydrocarbon sampling aids detection of seepage anomalies
It has been established that subsurface hydrocarbon reservoirs leak and that escaping gases cause numerous detectable alteration anomalies.1 2 The detection methods most often used require the capture and analysis of low molecular weight (C1-C5) gas phase hydrocarbons from near surface soils.1
Capturing soil gas hydrocarbons requires special sampling equipment and handling, does not allow for the proper integration of sampling at each location, and can be expensive to analyze. Methods are now available that directly detect hydrocarbons but do not require gas capture or special sampling tools, allow for adequate sample integration, and are competitively priced.
A previous article suggested that hydrocarbon analysis by ultraviolet-visible light spectroscopy offers an alternative to the capture and analysis of soil gas.3 A similar outcome to the analysis of soil gas hydrocarbons is obtained by measuring the amount of light absorbed by soluble hydrocarbons found in altered soil organic matter (SOM).
This article discusses the nongas-phase hydrocarbon sampling method and gives an example of its use at Big Red oil field, Rice County, Kan. (Fig. 1).
Additional methods
Additional hydrocarbon detection methods have been developed that use just visible light. These measure the hydrocarbons extracted by an alkaline solvent and detect color changes related to the chemical reactions between analytical reagents and reactive hydrocarbon functional groups.
Advantages to these techniques are numerous. Variables that can affect soil gas methods are depth, moisture, temperature, and physical and chemical changes in the samples after acquisition. These variables are eliminated when using nongas-phase hydrocarbon techniques.
For instance, it is often suggested that samples be taken at depth to avoid hydrocarbons that have been degraded by oxidation. This requires special sampling equipment. Also, changes in the soil profile are not observed, and the sometimes extreme physical and chemical variations that can occur between sample locations may not be adequately addressed in the interpretation.
Taking the sample from the very near surface eliminates the need for auguring or special tools and allows for greater sample consistency.
Sechman and Dzieniewicz,4 cite the problems associated with soil moisture when sampling soil gas in dry and wet sediments and discuss the necessity of leveling such data. Drying and sieving soil samples prior to analysis alleviates the need for data leveling due to changes in moisture content and yields more consistent survey to survey comparisons.
Temperature changes can enhance or degrade the hydrocarbon gas signature. Putting the samples under stress while auguring can increase the hydrocarbon concentration by frictional heat, yielding an artificially high background.
Many methods require elevated temperature to separate the gas phase from the soil matrix which can alter the character of the analyzed hydrocarbons. Methods using the soluble hydrocarbon fraction of the soil organic material can be run at ambient temperature and without the need for thermal desorption. The salting out of gas phase headspace hydrocarbons due to excess inorganic salts in the soil sample is also avoided using nongas-phase hydrocarbon techniques.5
Sufficient long-term data on the use of the nongas-phase hydrocarbon methods is not available to determine whether reservoir depletion will affect the near surface alteration signature. Due to the degree of assimilation of the seeping hydrocarbons into the SOM, if there is a depletion signature, it will manifest at a slower rate than when measured using standard gas chromatography.
Detecting hydrocarbons
There is no doubt that measurable quantities of hydrocarbons are found in soil gas.
However, nongas-phase hydrocarbons associated with the alteration anomalies that occur as a result of chemical reactions between SOM and seeping oil and gas hydrocarbons can also be used as seepage indicators.
Soil is a dynamic and diverse self-regulating medium of complex biological activity and chemical reactions featuring the elements C, H, O, and N. Not being static, seeping hydrocarbons from oil and gas reservoirs have ample opportunity to interact with SOM and take part in these reactions. The interactions might take the form of condensation and addition reactions in the complexation of humic substances, electrostatic interactions with existing humic substances, or be a component in the integration of carbohydrates into the soil environment by soil biotic processes.
Humic substances are formed by a series of complex biotic and abiotic reactions in which a variety of organic compounds are resynthesized to form large complex polymers. Peripheral pores in the polymers are capable of accommodating organic chemicals in its lattice as a clathrate compound.6 7 Typical components of humic substances are polysaccharides, fatty acids, polypeptides, lignins, and various combinations of benzene and aliphatic compounds. Humic substances are arbitrarily categorized based on solubility in water adjusted to different pH levels.7
Two physical condensation processes explain the production of humic substances. An amino acid reacts with a phenol derived from either the partial degradation of lignin or nonlignin carbon sources (possibly seeping hydrocarbons) used in microbial processes. These form aminoquinone intermediates, which can condense to form brown, nitrogenous humates.
The second pathway involves sugars reacting with an amino compound. The resulting addition compounds rearrange and fragment to form three intermediates (1) three carbon aldehydes and ketones, (2) reductones, and (3) furfuals. These intermediates react readily with amino compounds to form dark colored end products.6 7
In normally oxygenated soils, lignin may be broken down into low molecular weight products prior to humus synthesis. The products may be representative of the type seeping from reservoirs. Because these are condensation and not polymerization reactions, no two resultant molecules are identical.
Overall structure is a function of pH, ionic strength, and chelated metals. It is assumed that a higher than normal concentration of hydrocarbons will result in greater soil humification.
Fulvic acid contains less carbon and more nitrogen and oxygen than humic acids, and while its structure is generally similar to that of humic acid it has a smaller proportion of aromatic units and greater number of peripheral aliphatic chains. Carboxyl functional groups appear to be more evident in fulvic acid than humic acid and are probably heavily substituted on the aliphatic chains.8
Hydrocarbon anomalies
Fulvic and humic acids regulate many of the processes associated with soil development, and these same processes are also associated with the development of near surface hydrocarbon alteration anomalies.
The processes include movement of halogens, fragmentation and integration of aliphatic and aromatic hydrocarbons, pH buffering, oxidation and reduction reactions, cation exchange capacity, carbonate deposition, and the presence and growth of soil flora and fauna.9
While carbohydrates are not part of the core humic substances of soil, they are the second most abundant organic component in SOM. Carbohydrates are also the most abundant class of organic compounds found in living organisms. They originate as products of photosynthesis and are a source of metabolic energy, both for plants and animals that depend on plants for food. Additionally, carbohydrates also make up cellulose, the structural material in plants. In soils, carbohydrates participate in aggregation.14
Carbohydrates are by definition polyhydroxy aldehydes, ketones, or substances that yield one of these compound by hydrolysis. Glucose and fructose are examples of an aldose and a ketose, respectively. Acid hydrolysis is usually employed to release the monosaccharides from polysaccharides. Hydrolysis by water releases monosaccharides from disaccharides.10
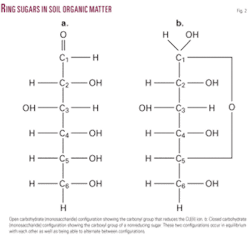
Many simple sugars can exist in a chain form or a ring form. The ring form is favored in aqueous solution, and the mechanism of ring formation is similar for most sugars. The glucose ring forms when the oxygen on carbon number 5 links with the carbon comprising the carbonyl group (carbon number 1) and transfers its hydrogen to the carbonyl oxygen to create a hydroxyl group (Fig. 2).
A reducing sugar is any sugar that, in basic solution, forms some aldehyde or ketone. Since sugars occur in a chain as well as a ring structure, it is possible to have an equilibrium between these two forms. When the aldehyde or ketone group is free (not linked to another sugar molecule), it is available for reducing Copper(II) ions. When a sugar is oxidized, its carbonyl group (aldehyde or ketone) is converted to a carboxyl group.
Carbohydrate levels depend largely on total organic matter content, so those factors that influence inputs of organic matter and rates of decomposition will also be those controlling total carbohydrate levels in soil.11 As excess seepage hydrocarbons in near surface soils are integrated into SOM, they will be acted upon by the same factors. A portion of these will become reducing sugars.
The nongas-phase hydrocarbons discussed are related to the analysis of fulvic acids (UV-Vis hydrocarbon analysis), humic acids (extracted hydrocarbon analysis), and soil carbohydrates (reduced hydrocarbon analysis).
Big Red field analog
Nongas-phase hydrocarbon methods have been used over prospects and analog fields from Wyoming to Tennessee, Texas to Ohio.
The surveys range from small to large (30 to 1,000 samples) on 100-m to 200-m grids. The analog presented in the article is Big Red field in Rice County, Kan. (Fig. 1). Production is from Cambrian age Arbuckle dolomites at an average depth of 3,600 ft.12
It is a survey of moderate size consisting of 173 samples covering 2.5 sq miles on a 200-m grid. The examples will focus on the 30 samples around the Big Red-3 and Big Red-4 wells. The field was chosen as an analog due to availability of 3D seismic and the probability that additional wells would be drilled.
Postsurvey drilling has resulted in one dry hole and a producer.
The dry hole was drilled between two producing wells and within the halo of a weak to moderate geochemical anomaly. Geologically the structure was there, but the top 9 ft of the Arbuckle was tight, leaving a thin zone of reservoir quality rocks. Though oil was present, the show was uneconomic and the well was plugged and abandoned.
The second well was drilled in a moderate to strong geochemical anomaly. Pipe has been set in the Arbuckle, and the well is being equipped for production.
UV-Vis hydrocarbon analysis
Because they are soluble through a large pH range, water extracted altered fulvic acids (AFA) are placed in solution and measured using UV-Vis spectroscopy.
AFAs are located in the halo position due to preferential binding of calcium to the oxygen containing carboxylic and phenolic groups in fulvic acids. Forming Ca-humates renders AFAs resistant to further decomposition by enveloping them in a carbonate film. The complexes formed are predominately electrostatic in nature.13 Calcium is the limiting factor in halo formation relative to the pervasive nature of CO2 in the soil environment.
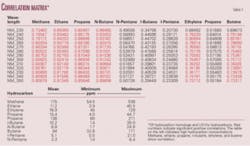
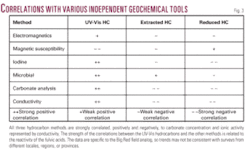
Analysis of AFAs by UV-Vis spectroscopy yields very high correlations when compared to hydrocarbon analysis by standard gas chromatography. Correlation coefficients of 0.96 have been obtained when comparing gas phase homologs to hydrocarbon absorbance values of UV-Vis spectra (Table 1). It is also possible to apply hydrocarbon characterization methods similar to those used for data acquired using gas chromatography.3 14 The UV-Vis hydrocarbon analysis of the fulvic acid portion of the SOM yields the greatest number of correlations with other geochemical methods due to a large pH range and number of reactive functional groups (Fig. 3).
The map of the UV-Vis hydrocarbon analysis shows the two productive wells within the halo low and the dry holes located within the halo itself. This well-defined halo encompasses about three-quarters of the seepage anomaly (Fig. 4).
Extracted hydrocarbon analysis
Altered humic acids (AHA) are soluble only at high pH and are therefore present in the high pH halo position of a seepage anomaly.
These are larger molecules containing more C and less O than fulvic acid. Due to structural similarities to fulvic acid, humic acid will follow many of the same physical and chemical models. The extracted hydrocarbon analysis (EHA) exhibits low to moderate correlation with other geochemical methods which may be related to the limited pH range (Fig. 3).
The map of the EHA shows the two productive wells centered inside the halo low and the dry holes located near or in the halo highs. As with the UV-Vis hydrocarbon halo, the EHA high values are present on at least three sides (Fig. 5).
Reduced hydrocarbon analysis
The monosaccharide portion of the SOM is water soluble and easily put into solution.
The open aldehydes and ketones are subsequently converted to carboxyls with the reduction of copper. The resulting colored solution is measured spectrophotometrically and an absorbance value is obtained. A high absorbance value is analogous to a high concentration. The RHA hydrocarbons exhibit low to moderate correlations related to the solubility differences between monosaccharides, disaccharides, and water insoluble polysaccharides (Fig. 3).
The map of the reduced hydrocarbon analysis (RHA) shows the two productive wells located on a narrow hydrocarbon high, or in an apical orientation, with the dry holes located in the hydrocarbon lows. Though not the normal configuration for geochemical anomalies, apical signatures do occasionally occur (Fig. 6).
Overall advantages
Soil gas sampling for hydrocarbon detection has been a valuable exploration tool for many years, but with the advent of these new hydrocarbon detection methods the acquisition and analysis has become simpler and more cost effective. The advantages are:
- Sample depth, moisture content, and temperature increases at sample acquisition, sample preparation, and at the time of analysis, are variables that have been eliminated, resulting in more consistent survey to survey comparisons.
- A larger range of hydrocarbons is employed. Rather than using the standard homologous sequence provided by gas chromatography, a larger set of hydrocarbons with distinct characteristics can mapped and interpreted. AFAs provide concentration data over a range of wavelengths that can also be used to characterize anomalies. AHAs provide a look at the heavier ringed hydrocarbon, and the carbohydrates yield anomalous concentrations that occur with increased microbial activity that can be associated with hydrocarbon microseepage.
- The correlation of the UV-Vis, EHA, and RHA hydrocarbon methods with other geochemical tools is moderate to good. Analysis of AFAs by UV-Vis spectroscopy yields very high correlations when compared to hydrocarbon analysis by standard gas chromatography. Correlation is in part, related to pH range, number of reactive hydrocarbon functional groups, and hydrocarbon solubility.
- Sample cost is significantly reduced due to decreases in field time, operation and maintenance of extra field vehicles, and special handling of samples. In the laboratory samples can be processed more rapidly by spectroscopy, eliminating the long elution times of standard gas chromatography.
Acknowledgments
Access to leases and geophysical data are courtesy of Gilbert & Stewart Operating LLC. The iodine analysis is provided by Graystone Exploration Labs. Consultation and comments are provided by JEL Resources LLC. ¿
References
- Abrams, Michael A., “Significance of hydrocarbon seepage relative to petroleum generation and entrapment,” Marine and Petroleum Geology, Vol. 22, 2005, pp. 457-477.
- Schumacher, Dietmar, “Hydrocarbon induced alteration of soils and sediments,” in “Hydrocarbon Migration and Its Near Surface Expression,” Shumacher, D., and Abrams, M.A., eds., AAPG Memoir 66, 1996, pp. 71-89.
- Fausnaugh, J.M., “Method is alternative to soil gas for detecting seepage anomalies,” OGJ, May 19, 2008, pp. 37-42.
- Sechman, Henryk, and Dzieniewicz, M., “Influence of soil moisture on the results of surface geochemical surveys applied to petroleum exploration,” Journal of Petroleum Science and Engineering, Vol. 56, 2007, No. 4, pp. 267-282.
- Fausnaugh, J.M., “The effect of high soil conductivity on headspace gas sampling techniques,” APGE Bull., Vol. 5, No. 1, 1989, pp. 96-115.
- Paul, E.A., and Clark, F.E., “Soil Microbiology and Biochemistry,” Academic Press Inc., 1989.
- Pettit, Robert, “Organic matter, humus, humate, humic acid, fulvic acid, and humin: Their importance in soil fertility and plant health,” http://www.humate.info, CTI Research, 2007.
- Cresser, Malcolm, Killham, Ken, and Edwards, Tony, “Soil Chemistry and its Application,” Cambridge Environmental Chemistry Series (No. 5), Cambridge University Press, 1993.
- Allard, B., Boren, H., and Grimval, A., eds., “Humic Substances in the Aquatic and Terrestrial Environment,” Lecture Notes in Earth Sciences, Springer-Verlag, 1991.
- Sposito, G., “The Chemistry of Soils,” Oxford University Press, 1989.
- Schnitzer, M., and Khan, S.U., “Soil Organic Matter,” Developments in Soil Science 8, Elsevier Scientific Publishing Co., 1978.
- Higley, D., “Cambridge Arch/Central Kansas Uplift Province,” National Oil and Gas Assessment of 1995, http://geo-nsdi.er.usgs.gov/catalog/.
- Schaetzl, R., and Anderson, S., “Soils: Genesis and Geomorphology,” Cambridge University Press, 2005.
- Fausnaugh, J.M., “Techniques characterize reservoirs,” American Oil & Gas Reporter, Vol. 39, No. 12, 1996, pp. 75-82.
The author
Jim Fausnaugh (jmfausnaugh @geotech.org) is the owner of geotech.org in Littleton, Colo. He has nearly 30 years of experience using surface geochemical techniques and has helped develop and introduce methods that have since become standard geochemical tools. He has performed all phases of sample acquisition, analysis, and interpretation with Skyline Labs, Petro-Mineral Exploration, Petro Labs, and GRDC Inc. He has a BS in geology from Fort Lewis College.
MadagascarNiko Resources Inc., Calgary, took a farmout from Enermad Corp., Calgary, on the 4.1 million acre Grand Prix block in the Mozambique Channel in Madagascar’s Morondava basin.
Niko will become operator and fund 100% of multiyear exploration to earn a 75% interest. Work will start with a multibeam bathymetric survey in mid-2009 and later a 3,000 sq km 3D seismic survey. The rest of the commitment will go for exploratory drilling.
The partnership ran a 31,000 line-km aeromagnetic survey in mid-2008 and is reprocessing 7,600 line-km of 2D seismic.
The block extends from tidal high-water mark to more than 1,500 m of water and is downdip of the Bemolanga and Tsimiroro multibillion barrel heavy oil deposits.


