Modeling optimizes casing points in Persian Gulf wells
Researchers modeled casing-point setting depths in National Iranian Oil Co.’s RSH field using various tools and scenarios to save as much as 15%.
RSH field is in the central Persian Gulf, to the east of the Qatar/Fars Arch. The RSH structure, although not affiliated prominently with salt, lies where salt tectonics dominates development of structures, many of which have major oil and gas accumulations.
Qatar/Fars Arch divides the Persian Gulf Precambrian salt basin into northern and southern salt basins. The RSH structure is in the southern basin, which has more eminent exposed salt plugs as the Persian Gulf Islands, and many unexposed plugs and swells that have formed four-way dip closures suitable for hydrocarbon entrapment.
General stratigraphy
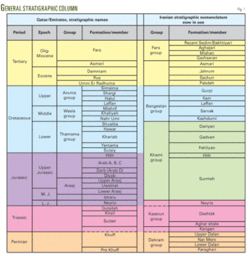
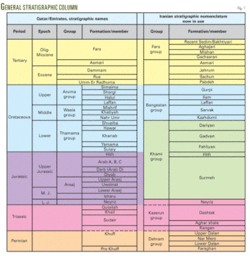
The following is a brief description of the general geological sequences encountered in a typical RSH well, as shown in Fig. 1:
• Sarvak (Mishrif) formation. The Sarvak formation is a limestone. Some cherty limestone beds may also be present in the middle parts of the sequence. The Mishrif member of the Sarvak formation constitutes a major oil-producing reservoir in the RSH field. The “Sarvak (Mishrif)” reservoir refers to the upper part of the Sarvak formation, equivalent to the Mishrif formation in the southern Persian Gulf.
• Kazhdumi formation. The Kazhdumi formation consists of layers of green and brown shales with some limestone. Few sand layers have also been noted in the sequence. Kazhdumi shales have been considered the main seal for hydrocarbons in the Dariyan carbonate reservoir.
• Dariyan (Shuaiba) formation. The Dariyan (Shuaiba) formation is a major oil-bearing reservoir in the RSH field and consists of light-colored, cream limestones, fine-grained, tomicritic, and microcrystalline, and slightly pyritic at the base.
• Gadvan (Kharaib) formation. The Gadvan (Kharaib) formation consists of interbedded limestone and gray brown shales. In nearby fields, such as Salman, limestone bands in the Gadvan formation are oil-bearing reservoirs.
• Fahliyan (Yamama, Sulaiy members) formation. The Fahliyan formation and its equivalent in the RSH field include light-colored limestones and dolomites. The Fahliyan formation has been divided into the Yamama and the Sulaiy members. The Yamama member generally consists of fine-grained, light-colored to cream limestones, becoming brownish and dolomitic toward the base. Beds of fine-grained to sugary, and occasionally cherty, dolomites are also present. The Sulaiy member consists of alternating layers of dolomites and limestones, becoming glauconitic towards the base.
• Hith anhydrite. The Hith anhydrite in the RSH field consists of thick layers of massive anhydrite with beds and bands of dolomites.
• Surmeh formation (Arab reservoir units). The Surmeh formation consists of an alternating sequence of dolomites, anhydrites, and minor limestones. In RSH field, the Arab part of the Surmeh conformably overlies the Darb-equivalent unit and is overlain by the anhydrites of the Hith formation.
The Surmeh (Arab) is divided into five lithologic units: Arab A, A1, B, C, and D, of which Arab D is the thickest and Arab A the thinnest. Lithologically, the Arab units consist of dolomites and anhydrites.
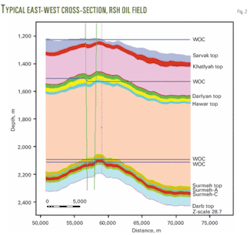
Based on the description of general stratigraphic column, Fig. 2 presents one of the possible scenarios of east-west cross-section for optimization casing points in RSH oil field.
Drilling plan, RSH oil field
National Iranian Oil Co. plans for the drilling contractor to use two jack up drilling rigs to perform drilling activities. The satellite platform (W0) houses only one rig at a time, but the main (W4) platform can accommodate two rigs at opposite sides of the platform if required. Table 1 shows the wells proposed to be drilled.
Well trajectory profile
After geologists and reservoir engineers identify drilling targets, it is the drilling engineer’s job to design the wellbore trajectory for these targets. For the case of drilling wells in RSH oil field, engineers must consider many factors, such as collision, trajectory geometric shape, true vertical depth and horizontal departure, inclination and azimuth, buildup rate, tortuosity, and torque and drag.1 All these factors should be evaluated together during trajectory design.
The objective of this article is not to optimize the well trajectory. Three optimized well trajectory profile are proposed for CPS problem and casing points should be optimized for these.
Fig. 3 shows W0-1 with trajectory profile II, III for optimizing casing points in W0-1:
• Drilling 17.5-in. hole, 133/8-in. casing. This hole drilled to 900-1,000 m to provide support to the wellhead and casing and allow for installation of the first BOP stack (or diverter) to ensure safe drilling of the next hole section. A 133/8-in. casing string will be run to surface and single stage cement job will be performed.
• Drilling 121/4-in. hole, 95/8-in. casing. This section drilled from 133/8-in. casing shoe to set 95/8-in. casing at the selected reservoir with casing shoe about 5 m inside the formation. This casing will allow installation of the 5,000 psi BOP stack to ensure safe drilling of the next hole section.
• Drilling 81/2-in. hole, 5-in. slotted liner. The 81/2-in. diameter hole section drilled horizontally from the 95/8-in. casing shoe to the planned section with TD at about 4,200 m within the selected formation. The setting depth may vary depending on reservoir target, actual conditions, and completion.
This horizontal section of the hole will be cased with 5-in. slotted liner in the hydrocarbon-bearing zone and will not be cemented. The 5-in. diameter slotted liner will be run with the liner hanger set about 100 m inside the 95/8-in. casing.
Optimization procedures
We demonstrate the accuracy and efficiency of the proposed methodology and model and apply it in a case study at RSH oil field, using the previous information and data available from NIOC.
The starting point is the three optimized trajectory plans. Due to some uncertainty in geology such as thickness of layers, we can propose three different geological scenarios with specific probability of occurrence for A, B, and C. Each scenario poses new constraints to the mathematical modeling, especially in lower and upper bound of casing points.
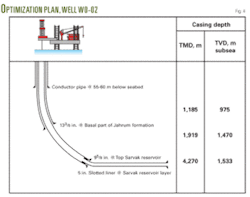
Finally, we select the maximum expected value of trajectories as the best trajectory. One of the outcomes of this study is to determine the optimum casing points and to find the best trajectory. We analyze the W0-2 well in Fig. 4 under different risk attitudes (Fig. 5).
In Fig. 5 we show risk attitudes ranging from r = –3 to r = 3, with different optimal solutions that depend on decision maker. For each r the highest expected value is the optimum solution of trajectory and casing points.
For example, where r = –1, the best trajectory has the maximum expected value 0.615, meaning that trajectory II is the best. This amount is the sum of three expected subvalues from three scenarios.
To determine the best casing points, we select expected subvalues with the highest U*P value (0.252). Finally, we find that for r = –1, the best trajectory is profile II and the best scenario for selection casing point is scenario A.
For r = –2, r = –3, and r = 0, the same condition is found as for r = –1.2 3
If we consider other values of r, we observe the optimum solution shifting to other trajectories and scenarios. For example, in r = 1, r = 2, and r = 3, the best trajectory becomes trajectory I and casing points set on scenario A for r = 1, instead of Scenario B.
Fig. 4 shows the optimization plan for W0-02. We calculated the points from an average of points among risk seeking, neutral, and risk averse. We conclude from Fig. 5 (W0-2 well) that 57% profile II is the best trajectory and 43% profile I is the best trajectory.
To optimize other wells, we selected another two wells from the case study using Lingo 8. The results obtained from solving the model for the W4-07 and W4-19 wells are discussed below using the same procedure as used for the W0-2 well.
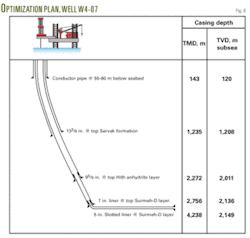
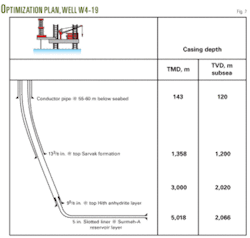
W4-07 is a well with three casing points for 133/8-in., 95/8-in., and 5-in. diameter casing. The results appear in Figs. 6 and 7. The next step was to run the model using data gathered from RSH oil field for the other wells. Table 2 summarizes the optimization plan for different wells.
Analysis of results
We performed a sensitivity analysis for various cases. In this case study, we investigate the sensitivity of the optimization result to the varying risk attitudes and the effect of varying risk attitudes in the optimization of casing points (Table 3).
There were three different runs performed for a risk-averse (r = 1, r = 2, r = 3), risk-neutral (r = 0), and risk-seeking (r = –1, r = –2, r = –3) decision maker with the aim of finding the optimum objective function under the different risk attitudes. Fig. 8 shows the optimum objective functions under different risk scenarios.
When the decision maker moves from r = –1 to r = –3 (i.e., allows more risk) the objective function decreases. This is expected because the utility amount that decision maker earned decreases as well. When we move from neutral to averse risk (i.e., allows less risk), the objective function increases.
Fig. 9 shows the average of the best solution under different risk attitudes. As expected, the objective function of the optimal solution found under risk-seeking conditions is the lowest, while the solution under risk-averse conditions is the highest. The result for the risk-neutral case lies between those of the risk-seeking and risk-averse solutions.
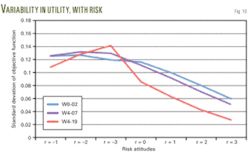
The expected value for the risk-averse case has the highest amount but also displays the least variability (standard deviation) of utility across the three risks in Fig. 10.
Table 4 shows optimum intervals for casing points in each section, the selection in these intervals depends on the decision maker. We select the average of upper and lower range of this interval as final optimum points.
After a complete analysis of results about objective function, we can define an optimum interval to set casing points, depending on decision-maker risk attitude and different scenarios. The worst-case and best-case geologic scenarios determine the upper and lower bounds.
If we define other cases, we will find an optimal solution between upper and lower points. Points outside of this interval are not optimum; therefore, they do not represent economical conditions.
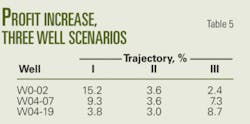
Now we can calculate percentage savings when the optimum solution moves between two optimum points (Table 5).
For example, in Well W0-02 we have three different scenarios: A, B, C. The optimum solution in this scenario had a maximum 15.2% savings compared with other scenarios for profit saving in trajectory I.
Observations
In this study, to optimize casing point selection under geological uncertainty, we observed that:
- Using multiple scenarios in the RSH field provides better decisions to determine the best casing setting points in wells, with predicted savings of 2.4% to 15.2%.
- The casing point planning (CPS problem) extension to the uncertainty environment is a good tool to determine casing setting depths of wells.
- The more data available, the smaller the uncertainty and the better the resulting decisions.4
Acknowledgment
The authors gratefully acknowledge the cooperation of National Iranian Oil Co. for its support in preparing data from RSH oil field.
References
The authors
Rasool Khosravanian ([email protected]) is a PhD student in the department of industrial engineering at Iran University of Science and Technology (IUST), Tehran. He previously worked for Iranian Offshore Engineering and Construction Co., National Iranian Oil Co., and PEDEX. Khosravanian holds a BS (1998) in mining and petroleum engineering from University of Kerman and an MSc (2000) in industrial engineering from IUST. He is a member of SPE.
Bernt S. Aadnoy ([email protected]) is professor of petroleum engineering at University of Stavanger. He began working with Phillips Petroleum in Odessa, Tex., in 1978 and has also worked for Saga Petroleum, Statoil, and Rogaland Research. Aadnoy received a mechanical engineering degree (1975) from Stavanger Technical College, a BS (1978) in mechanical engineering from the University of Wyoming, an MS (1979) in control engineering from the University of Texas, and a PhD (1987) in petroleum rock mechanics from the Norwegian Institute of Technology. Aadnoy received the SPE International Drilling Engineering Award in 1999 and a Conoco-Phillips Award in 2003, and was elected a member of the Norwegian Academy of Technological Sciences and the Russian Academy of Natural Sciences.
M.B. Aryanezhad ([email protected]) is the director of the industrial engineering program at Iran University of Science and Technology (IUST), Tehran. He began working at IUST in 1985 as the dean of graduate studies and has served as dean of the department. Aryanezhad holds a BS (1974) in physics engineering from Sharif University of Technology, an MS (1976) in operations research from University of California at Los Angeles, and a PhD (1980) from UCLA. Aryanezhad is a member of Institute of IE, Institute of Management Science and OR, European OR Soc., Asian Pacific OR Soc., Iran Institute of IE, Tehran Academy of Science, and the Iranian Mathematical Society.
Abbas Naderifar ([email protected]) is professor and head of the department of petroleum engineering, Amirkabir University of Technology, Tehran. He also teaches in the department of chemical engineering and has worked on projects for National Iranian Oil Co. Naderifar holds a BSc (1986) and MSc (1989) in chemical engineering from Theran Polytechnic, Amirkabir University of Technology, and a PhD (1995) in chemical engineering from Institut National Polytechnique de Lorraine, Nancy, France.
Ahmad Makui ([email protected]) is a member of the faculty of industrial engineering at Iran University of Science and Technology, Tehran. Makui holds a PhD (1999) in Industrial Engineering from IUST.
