SPECIAL REPORT: Global LNG trade to 2020 marked by uncertainty
The current outlook for LNG is probably more uncertain than it has been for many years. This is the result of several factors, among which are:
- The speed with which LNG demand, particularly in North America, Spain, and the UK, has developed.
- The inherently slow response time of LNG supply to the sharply increased demand signals
- The supply lags have created a shortage of LNG supply relative to expectations.
- The burst in demand for new plant capacity, which has taxed the capabilities of experienced design and construction contractors and sophisticated machinery suppliers. This has led to a sharp “demand pull” inflation on capital costs. Costs are not only much higher than expected, but the potential for cost overruns and construction delays has increased. It is not clear how severely this has affected plans of the many projects that are under active consideration.
- The sharp increase in world energy prices. The effect of these higher prices on gas demand and on interfuel competition is not well understood.
- The uncertainties raised by environmental concerns. Pressures to limit coal utilization may tend to favor gas-fired power generation despite higher gas prices. This is a particularly important issue in China, where absent government policy intervention, high-priced gas would find it very difficult to compete with low-cost coal.
- The persistence of difficult geopolitical issues surrounding the natural gas export policies of a number of countries, such as Bolivia, Nigeria, Iran, Russia, or Venezuela. It is difficult to foresee the roles the countries will play in LNG supply between now and 2020.
- And last, but not least, the fact that LNG demand is inherently sensitive to small changes in world gas supply-demand balances. Where LNG is the “swing” source of gas supply for a gas importing country, small changes in its indigenous gas supply or demand magnify the effect on its LNG imports.
These uncertainties make it unrealistic to expect any forecastno matter how well doneaccurately to predict specific LNG trade flows out to 2020. This article, however, summarizes a recently completed projectionin three scenariosof world LNG trade to 2020 done by Jensen Associates for the California Energy Commission.
More conservative
If one can generalize about most published world and regional gas forecasts, they tended to become more optimistic about gas demand in the 1990s as the enthusiasm for gas-fired combined cycle power generation took hold. Then, supply problems in North America and the North Sea injected a note of supply concern into many estimates.
Initially, the tendency of most forecasts was to retain much of the demand optimism while transferring some of the responsibility for gas supply to imported LNG. During this period, demand estimates tended to remain high, and LNG tended to substitute for some of the projected loss of indigenous natural gas.
But there was a growing recognition that supply was the principal determinant of the growth of world LNG trade. Now, in a more common forecast pattern, estimates reduce the amount of gas for future power generation and are more conservative about LNG trade.
At the same time that forecasts were adjusting to supply constraints, the rapid increase in world energy prices threatened to blunt the growth of overall energy demand and alter the balance between fuels in interfuel competition. This added an additional conservative element to the forecasts.
The two major governmental organizations that publish world energy forecaststhe International Energy Agency and the US Energy Information Administrationboth publish projections of future world gas supply and demand. A review of their projections over the past several years reveals a trend towards reduced expectations for total world gas demand and for interregional gas trade.
For EIA, it is possible to compare its expectations of total world gas consumption for 2020 in both its International Energy Outlook 2002 (IEO2002) and its IEO2006. Total consumption shows a decline of 7.4% between the forecasts made 4 years apart.
For the IEA, a comparison of total consumption for 2030 (IEA does not project 2020 in both documents) is possible for its World Energy Outlook 2002 (WEO2002) and its WEO2006. Its total consumption projections decline 7.8%. But indicating the sensitivity of trade to the new, higher priced environment, its projection of interregional gas trade declines by 22.4%.
This pattern of declining gas demand and LNG trade forecasts over time is significant. It suggests that some LNG demand estimates made during the early 2000s might now be regarded as too optimistic and therefore unsuitable for a base or reference case. It is this view that has led our study to start with the most recent governmental projections to form the base case and utilize some of the earlier, more optimistic estimates, to develop a “high” scenario.
It is important to recognize that our projections are on the low side compared to many public projections of future LNG trade. Their conservatism results from two underlying assumptions. We accept the IEA’s and EIA’s view that higher prices have reduced expectations of gas demand and world gas trade. But we are impressed that many of the LNG supply problemshigh costs, technological challenges, and geopolitical concernsmay slow the process of making supply available.
Escalating costs
For an extended time, design improvements in liquefaction plants and tankers had the effect of reducing costs. As recently as 2003, it was common to assume that this was a “learning curve” effect and would continue.
But this perception of steadily falling costs for LNG has been dashed in recent years. The surge in demand for LNG that began in the late 1990s has taxed the capabilities of experienced engineering-procurement-construction (EPC) contractors and manufacturing capacities of firms supplying some of the sophisticated materials and machinery required for LNG. The result has been a very large supply bottleneck for construction of new plants.
There are a very few EPC contractors with the experience to handle the complex construction that LNG requires, and they are effectively overloaded. While one might expect over time that new entrants in the field would learn to become reliable suppliers, the risks in the short term are that projects built by the newer contractors will fail to come in on time and on budget. Meanwhile, “demand pull” inflation has hit the industry and reversed the long period of declining costs.
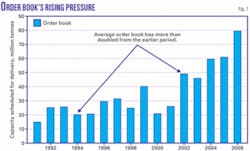
The reason for the “crunch” on the suppliers is evident in looking at the growth in demand for new capacity. With a typical 4-year design and construction period for most LNG plants, the plants scheduled to come on line over the next 4 years might be described as the “order book.”
Fig. 1 shows the order book has more than doubled since 2002 from the period 1991 to 2001, graphically illustrating the pressures on the suppliers.
It is extremely difficult to get reliable estimates of what is happening to costs at present. What is apparent is that there is a wide dispersion in costs for liquefaction plants that are currently under construction.
There are also a number of “problem trains” that have dramatically higher costs than one might expect from trends in historic cost patterns. It is difficult to separate the special problems that have escalated construction costs of these plants from the current pressures on costs that are applicable to construction costs in general.
Norway’s Snohvit, Russia’s Sakhalin II projects, and a new Iranian North Pars construction bid are reported in the trade press to have costs in the range of $1,000 to $1,222/tonne of liquefaction capacity. A reasonable range of costs for these projects in 2000 construction environment might have been $250-300/tonne. Current costs for those projectsassuming no problemswould probably be more than double those levels.
Both Snohvit and Sakhalin II experienced very large cost overruns, but both are Arctic projects and seem to have experienced “learning curve” problems. The Iranian bid is for a project whose government is under international sanctions and has difficulty getting competitive bids from experienced EPC contractors.
It is always dangerous to assume that “cost shock” levels are permanent and will persist throughout the period of a long-term forecast. But it is very difficult to determine what a more stable long-term cost structure might look like.
What is apparent, however, is that the current high-cost environment has reduced the order level for new LNG liquefaction capacity that might be expected to come on line in 2012 or later. If this pattern persists, new capacity expected to become available beyond 2012 will be in doubt.
If the burst in new orders 2002-06 has set the stage for a surge of new LNG capacity 2010-12, the current ordering pattern suggests a dip in new capacity beyond 2012.
The forecasts
In all three scenarios, the approach was first to develop a forecast of LNG trade as a “control” and then to match sources and markets to the projection. The starting point for the reference case was the gas projections in IEA’s WEO2006. Although it provided a basis for the overall projections, the forecast made use of many other sources to arrive at its final estimates.
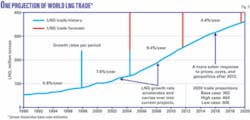
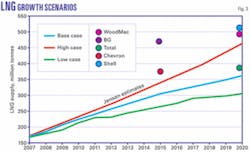
The base-case estimate for 2020 is 362 million tonnes (Fig. 2); the scenario range is 306-464 million tonnes.
It is important to note that this forecast is more conservative than most others (Fig. 3). Its conservative estimates reflect two basic assumptions:
- It adopts the view of IEA and EIA that high prices have moderated the demand for natural gas and reduced the potential requirements for interregional gas trade.
- It does not foresee early resolution to the industry’s cost, geopolitical, and arctic technology problems.
Whence supplies?
World reserves of natural gas are very large and appear more than adequate to support gas exports far into the future. But many of those reserves are where economics, technology, or geopolitics raise questions about how quickly they will become commercially available.
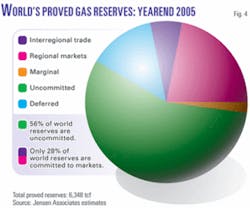
Some portion of the reserves are already committed to markets, either for domestic consumption or contracted for export through pipeline or LNG infrastructure. Other gas is “deferred” because it is involved in oil production, either for reinjection, in gas caps in producing fields, or “long reserves” (dissolved gas that will not be produced until far into the future when the oil is recovered).
Fig. 4 shows our estimated market status breakdown of world gas reserves as of yearend 2005. Fully 54% of the world’s reserves are currently uncommitted. While not all of the gas is available for current exports because producers reserve some of it to back up existing pipeline and LNG export contracts, uncommitted gas is the major source of new projects. Undiscovered resources will also become available at some time in the future, as will the deferred gas, as its involvement in oil production changes.
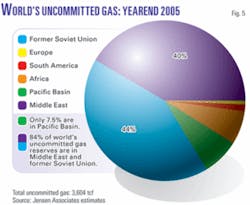
Eighty-four percent of the world’s uncommitted reserves, however, as well as much of the undiscovered resource base are in the Middle East and the former Soviet Union (FSU; Fig. 5). It is significant that the FSU has historically exported entirely by pipeline, while the Middle East has exported its interregional volumes as LNG. We expect that future FSU exports will remain predominantly via pipeline and Middle East exports predominantly via LNG.
The start-up of Russia’s Sakhalin II project next year will represent that country’s first entry into LNG export. Sakhalin island is proving to be hydrocarbon-rich and is well situated to serve Pacific Basin LNG markets. But the question of how much of that resource is ultimately used to support LNG exports raises complex Russian geopolitical issues.
Russian gas projects in Sakhalin and Eastern Siberia have been developed, not by Gazprom, as in the West, but with participation of international oil companies. Shell has operated Sakhalin II, ExxonMobil Sakhalin I, and a BP affiliate the Kovykta field near Irkutsk.
The Russian government used severe cost overruns on Sakhalin II and environmental issues to reopen its licensing agreement with Shell. Following very difficult negotiations, Shell ultimately relinquished control of the project to Gazprom (OGJ Online, Dec. 21, 2006).
Subsequently, Russia reopened the licensing agreement with a BP subsidiary for Kovykta. These moves suggest that the Russia wants to reexert centralized control over East Siberian and Sakhalin reserves.
The country appears to be trying to develop a coordinated internal gas transportation grid from which it can serve both domestic and export markets. It has shown an interest in a pipeline system that would link Sakhalin and East Siberian reserves with its West Siberian reserves that serve Eastern and Western Europe. Such a system would give Russia the choice of LNG or pipeline exports as well as destination flexibility to serve Atlantic basin or Pacific basin markets.
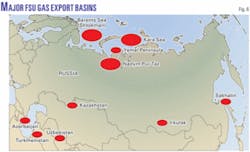
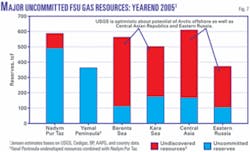
But it is in the West where some of the Russian policy questions have the greatest potential impact on world LNG markets. In West Siberia, the Nadym-Pur-Taz region has been the workhorse of the Russian gas industry. Russia has three other, as yet undeveloped, major potential producing regions that hold much of the uncommitted gas: offshore Barents Sea containing the super giant Shtokman field; Yamal Peninsula; and offshore Kara Sea (Figs. 6 and 7).
Nadym-Pur-Taz contains the world’s second and third largest gas fieldsUrengoi and Yamburg. But these two fields, together with another super giantMedvezhyeare in advanced stages of depletion at a decline rate estimated at 2 bcfd/year.1 In 2002 Gazprom brought another supergiantZapolyarnoyeon line to maintain production rates.
But Russia appears to want to tap the other major undeveloped producing basins before undertaking significant further market expansion. These new reserves are likely to be costly and, in the case of the Arctic offshore fields, technically difficult.
For a time, it appeared that Russia favored a pipeline from the Yamal Peninsula to Western Europe as the next step. Russia has alienated some of its major European customers, however, both through supply interruptions to the Ukraine (that were perceived by some as politically motivated) and Russian refusal to allow independent Russian producers access to Gazprom’s pipelines, a third-party access policy the European Union strongly advocates. Some of the European interest in LNG is partly motivated by a desire to diversify away from too much dependence on Russian supplies.
Emergence of North American interest in LNG appeared to offer Russia a diversification option of its own. By shifting to the Shtokman field in the Barents Sea, Russia contemplated a landing at Murmansk that could supply an LNG export facility as well as be extended south to St. Petersburg, where it could supply both Russia’s new Nordstream Pipeline under the Baltic and also a small proposed LNG facility at Primorsk.
More recently, Russia seems to have cooled somewhat on the idea of a Murmansk LNG export facility, although it still is interested in the Shtokman pipeline connection to the Baltic. It has not given up on the Yamal option, however.
Development of Shtokman faces a technological challenge because of its Arctic offshore location. Several international oil companies were attempting to join with Gazprom to develop Shtokman. Although the Russian government at one point rejected their overtures, they appear to be back on the table with the signing of an agreement with Total (OGJ Online, July 13, 2007) and StatoilHydro (OGJ Online, Oct. 26, 2007).
The uncertainties involving Russia’s gas export plans have a substantial impact how Atlantic basin LNG develops. If Russia decides to concentrate on pipeline exports, which it knows best, and if the European customers grow more comfortable with Russian gas policies, it would have two effects on future LNG trade: It would reduce Russia’s LNG offerings, but it also would reduce European competition for LNG. Europe has the pipeline as well as the LNG option. North America and most of the Pacific basin must rely on LNG for interregional trade.
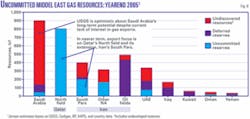
The Middle East accounts for 40% of both the world’s proved reserves and its uncommitted reserves. But 61% of the region’s uncommitted gas is in a single gas field shared between Qatar (the North field) and Iran (South Pars). If one adds in the uncommitted gas elsewhere in Iran, those two countries account for nearly 90% of the Middle East’s uncommitted gas (Fig. 8).
Qatar began its first LNG exports in 1997 and has elected an aggressive policy of LNG expansion since that time. It is expected to account for nearly 40% of the entire world’s increase in capacity 1996-2011.
Qatar has adopted a “wait and see” policy for further LNG expansion beyond that point, however, both to digest the consequences of its rapid growth and better to understand how the complex gas field behaves. Thus what has been the engine of recent Middle East LNG supply growth will be switched off, for how long it is difficult to tell.
The United Arab Emirates (Abu Dhabi) and Oman are also LNG exporters, and Yemen has an active project under way. But the early outlook for expansion from these sources over the forecast period is limited.
The US Geological Survey is very optimistic about undiscovered gas resources in Saudi Arabia, but that country has not yet found that gas nor shown any interest in gas exports. As long as Qatar maintains its decision against expansion beyond 2011, further Middle East LNG growth 2011-20 will have to come largely from Iran.
That country faces two issues that do not apply to Qatar: It has a very rapidly growing domestic market (fueled in part by subsidized pricing policies) and it needs gas for reinjection into its complex oil fields. It is developing South Pars on the basis of 20 (perhaps as much as 23, if the gas proves to be there) production blocks of about 1 bcfd each.
Five of the first eight blocks are designated for domestic markets and three for oil field injection. Exports will not be implemented until Blocks 9 and 10 come on stream at some point in the future. Five LNG projects have been proposed for subsequent North Field blocks, as well as several that would utilize other Iranian gas fields.
The issue of whether to export LNG is of itself controversial within Iran, but the largest barrier to Iran’s development of LNG is the international political climate. The imposition of sanctions on Iran, which have recently become more binding with the standoff over nuclear enrichment, denies Iran access to technology and most international markets. Although the current geopolitical standoff will presumably not last forever, it is very difficult to put any realistic time line on when Iranian projects are likely to be commercialized.
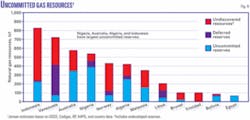
Other countries have significant available reserves for LNG export Fig. 9. But geopolitical issues that inhibit LNG development are not unique to Russia and the Middle East. Bolivia, Libya, Nigeria, and Venezuela have substantial gas reserves and potential LNG projects under consideration. But each of them faces geopolitical problems in developing new LNG projects.
Our base case assumes that some of these geopolitical problems will be resolved and some of the supply potential will be realized. But the bulk of the supply limitations that define our low case comes from projects that have been proposed for these regions.
Regional implications
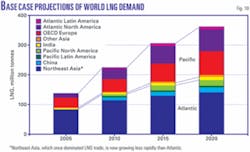
The base case envisions a world LNG demand growing to 362 million tonnes by 2020 from 138 million tonnes in 2005. While Atlantic basin markets will grow much more rapidly over the period than the Pacific basin markets, they still will not surpass the Pacific over the forecast period (Fig. 10).
The three biggest importing regionsNortheast Asia, OECD Europe, and the North American Atlantic Coastamong them account for more than 80% of world trade. Despite their potential importance, China and India account for only 5% and 3%, respectively.
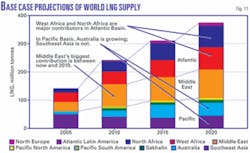
Qatar dominates LNG supply additions out to 2011but has adopted a “wait and see” policy for further expansion beyond that point. While it is probable that Qatar will revisit that conservative policy at some point, it is speculative to include further Qatar supply beyond 2011 (Fig. 11).
Beyond 2010, the greatest contributions to base-case supply come from North Africa, West Africa, and Australia. Southeast Asia, given some of the problems in Indonesia, does not show significant growth.
Indonesia, which was the world’s largest LNG supplier as recently as 2005 until being surpassed by Qatar, shows virtually no growth in the forecast. The country is grappling with the desire to use more of its gas domestically, and we expect it to limit export growth to new projects. On the other hand, Australia emerges as the second largest supplier after Qatar by 2015, followed closely by Nigeria.
Reference
- Stern, Jonathan, The Future of Russian Gas and Gazprom, Oxford Institute for Energy Studies, 2005, p. 9.
The author
James T. Jensen is president of Jensen Associates, a consulting firm in Weston, Mass. He began his consulting career in the energy group at Arthur D. Little Inc., Cambridge, Mass., and formed Jensen Associates in 1973. He received the 2001 Award for Outstanding Contributions to the Profession of Energy Economics and its Literature from the International Association for Energy Economics. He prepared the background study on LNG for the report by the National Commission on Energy Policy and completed a monograph for the Oxford Institute for Energy Studies entitled “A Global LNG MarketIs It Likely? If So, When?” Jensen is a past president of the Boston Economic Club and a member of the International Association for Energy Economics, the National Association of Petroleum Investment Analysts, the Oxford Energy Policy Club, the IFP Energy, Oil and Gas Club, and SPE. He holds a BS in chemical engineering from M.I.T. and an MBA from Harvard Business School.
