Williams Production Gulf Coast Co. is simultaneously fracturing wells in North Texas to improve production rates.
Since 2005, Williams has drilled more than 100 horizontal wells in the Barnett shale, an unconventional gas reservoir that underlies a 19-county area in the Fort Worth basin. Slick-water fracturing is the primary technique used to hydraulically fracture the wells.
Recently, Williams and several other operators tried fracturing two or more adjacent wells simultaneously with the goal of exposing the shale to more pressure and produce a more complex web of fractures, thereby improving the initial rates and reserves. Simultaneous fracturing or “simo-frac” technique is expensive and requires much more planning, coordination, and logistics as well as a larger surface location than single frac jobs.
This article discusses the case history of sequential and simultaneous fracturing of four similarly drilled and completed horizontal azimuth wells in eastern Parker County, Tex. All four wells were stimulated with near identical fracture treatments. Three wells with sequential and simultaneous fracturing had initial production (IP) of 3.3-3.5 MMscfd with 30-day averages ranging from 2.1-2.9 MMscfd. The fourth well was a single offset, horizontal well drilled with effective lateral length of 2,400 ft, located less than a quarter mile north of the first three wells. But Well D had significantly lower IP of 2.3 MMscfd and 30-day average production of 1.2 MMscfd.
The initial comparative test results are very encouraging and indicate that the sequential and simultaneous fracturing creates a more complex fracture network, which results in significantly improved well production.
Williams continues to evaluate the benefit of simultaneous fracturing and has done more simo-frac jobs in other counties with good results. Due to surface and lease constraints, many of the simo-frac jobs are performed in wells that are drilled from the same dual pad and have well spacing on the order of 500-700 ft. We provide an analysis of the simultaneous fracturing jobs completed to date in Parker and Johnson counties.
Barnett activity
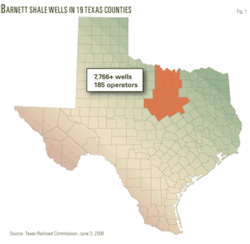
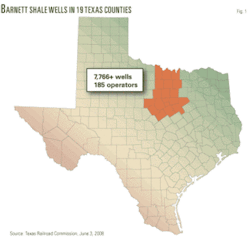
The Barnett shale has evolved into the preeminent shale-gas resource plays in the US and is now considered by many as the largest onshore natural gas field in the US. The estimated productive part of the formation covers 5,000 sq miles, encompassing 19 counties (Fig. 1).1
According to the latest figures published by the Texas Railroad Commission (RRC) in June 2008, there are more than 7,700 producing wells and 185 active operators in the Barnett shale, holding permits for more than 4,500 additional wells.
Production from Barnett shale currently exceeds 3.7 bcfd, accounting for more than 15% of Texas gas production. The Barnett shale has produced more than 3.8 tcf natural gas since 2000.2
‘Simo-fracs’
Simultaneous fracturing of paired, offset wells is one of the recent trends in Barnett fracturing and is being increasingly used by many operators. In this technique, two or more adjacent wells that are roughly parallel to each other are fractured simultaneously. The goal is to expose the shale to more pressure and produce a more complex, three-dimensional web of fractures, increasing the density and surface area of the hydraulic fracture network. The drainage area of each of the wells is enhanced as the frac fluid is pushed into the space between the two wells that would not have been fractured if the operator had stimulated only well.3 4
Simo-fracs are expensive and require more coordination, logistical work, and a larger footprint than a single frac job. At the same time, they are cost-effective because the frac equipment is utilized more efficiently; two wells are completed in 1 week instead of 2 weeks.
Initially, simultaneous fracturing in the Barnett involved dual fracs, involving two horizontal wells close to each other. Today, operators are experimenting with triple simultaneous fracs or even quad-fracs.
Case history
Williams used three horizontal wells in eastern Parker County to experiment with sequential and simultaneous fracturing.
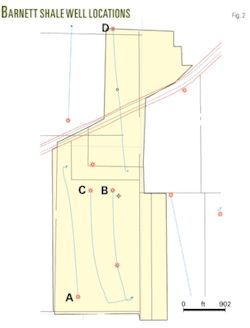
Fig. 2 shows the well layout of the wells. Well A, with a 2,200-ft long lateral, was drilled from a separate pad. Two other wells, Well B and Well C, with lateral lengths 1,900-2,000 ft, were drilled from a single pad. Wells A and C are spaced 900-ft apart at the heel and about 500 ft at the toe.
Williams drilled a fourth, stand-alone horizontal well, Well D, with an effective lateral length of 2,400 ft, less than half mile to the north. Due to lease constraints, only one well could be drilled from the Well D pad.
Stimulating Wells A, B, and C involved both sequential and simultaneous fracturing. Hydraulic fracturing of Well A was completed in five stages during the first week, followed by simultaneous fracturing of Wells B and C the following week.
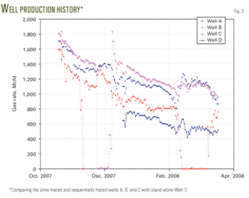
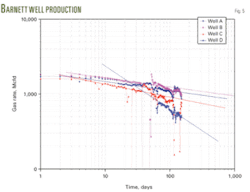
Fig. 3 shows the production performance of the four wells over the first 6 months of their production lives. The three simo- sequentially fraced wells had IP rates of 3.3-3.5 MMscfd and the first month averages ranged 2.1-2.9 MMscfd.
The stand-alone Well D well to the north had significantly lower IP of 2.3 MMscfd and the first-month average production was lower, at 1.2 MMscfd.
The initial results for the simo- sequentially fraced wells are encouraging and indicate that a more complex fracture network was created near the simultaneously fractured wells, contributing to significantly improved well performance.
The graph in Fig. 3 shows that the average 5-month production of the three sequentially fraced, simo-fraced wells was almost double that of stand-alone Well D. Well D was completed and had first sales about a month later than the three sequentially-fraced, simo-fraced wells. Well B has the best production among the three wells; it may be draining a larger area to the east. The Well A fracture network was likely enhanced due the subsequent simo-fracing of Wells B and C, resulting in enhanced production. Well C has the lowest production among the three wells, which may be attributed to interference effects from the two offset wells.
Successive stimulations using a multistage treatment often show a significant influence of the previous stage, including potential charging of the reservoir. The fluid from the previous stage remains at a somewhat elevated pressure, pushing subsequent stages away due to increased stress generated by the volume of pressurized fluid.5
In general, reactivation of existing fracture networks is thought to be less beneficial than creating new fracture networks.6 The production data from the three wells appear to indicate that simo-fracing results in more enhanced fracture network and production gains, compared to sequential fracturing. This aspect needs to be further studied; more data are needed to validate this inference.
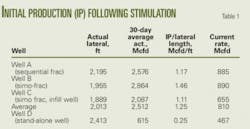
Table 1 compares the IPs of the simo, sequentially fraced wells with the stand-alone Well D. The average IP during the first 30 days shows a fourfold improvement due to sequential and simo-fracing. Based on IP/linear ft of lateral drilled, the simo-fraced wells showed a fivefold improvement.
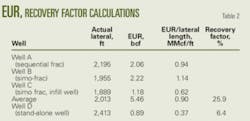
Table 2 shows a summary of the estimated ultimate recovery (EUR) and recovery factor calculations. We based EUR estimates on decline-curve analysis and estimated gas-in-place assuming a drainage radius of 500 ft from the toe and the heel of the horizontal wells.
We calculated the combined drainage area for the three wells (A, B, and C) at 130 acres and the drainage area for Well D at 85 acres. Based on a gross reservoir thickness of 335 ft, a reservoir porosity of 3%, the calculated corresponding gas-in-place (GIP) was 21.1 bcf and 13.8 bcf, respectively. The adsorbed gas GIP is based on a gas content of 96 scf/ton.
The analysis indicates a four-fold increase in recovery factor, to about 26% for the simo-fraced wells, from 6.4% for the stand-alone Well D. The average EUR per lateral length also showed a 2.5-fold increase and was 0.9 MMcf/ft of lateral for the simo-fraced wells vs. 0.37 MMcf/ft of lateral for the standalone well.
This case shows a significant enhancement in IPs, EURs, and recovery factors because of simultaneously fracturing the wells compared with individually fracturing a stand-alone well.
Production data analysis
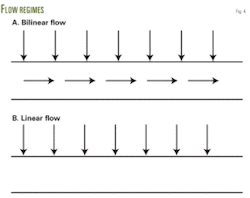
Conventional graphical-interpretation techniques in hydraulically fractured tight-gas wells are typically based on analyses of flow-regimes, such as linear, bilinear, or pseudoradial flow. For low-permeability wells, the time required to reach radial flow can be impractically long; most of the production data in Barnett wells are either bilinear or linear flow.
In bilinear flow, the flow occurs both inside the fracture and outside the fracture, perpendicular to the fracture (Fig. 4). If the fracture has low permeability, bilinear flow will occur over a longer period. On the other hand, in linear flow, the flow occurs only perpendicular to the fracture. If the fracture has sufficient permeability, bilinear flow will last for a short period before linear flow begins.
Fig. 5 shows production data from the four wells on a log-log diagnostic plot of production over several months. Well D production data occur closer to bilinear flow (slope = 0.25) compared to the other three wells, which can be represented by linear flow (slope = 0.5). This implies that the quality of fracture is not as good in Well D as in the other three wells, which may be due to the types of fracture created. Since the three southern wells were simultaneously fractured, it is likely that better fractures were created in these three wells as compared to Well D.
Frac data analysis
We reviewed the data from the fracturing jobs to evaluate possible reasons behind benefits from simultaneous, sequential fracturing. It has been suggested that interaction of the fluid from the different fractures might provide additional energy to enhance the intensity of fracturing, either through higher net pressures or forced diversion of the fluids as they contact other fluid-filled fractures.5
Table 3 summarizes frac fluid recoveries and net pressures for the four wells. The results indicate better production performance from Wells A and B, which had higher net pressures, 1,000-1,600 psi, compared to the other two wells.
The percent-fluid recovery also appears to correlate with well production performance. Warpinski et al. suggested that rapid fluid cleanup with a high percentage of load recovery (>50%) may actually indicate that significant fracture network was not generated and only a simple fracture was created that acts like a “balloon” and quickly deflates back into the wellbore.7
The data are not consistent with the above observation and further analysis is needed. In the first 100 hr of flowback, Wells A and B had higher fluid recoveries, 20.8% and 10.5%, respectively, whereas the other two wells had fluid recoveries of 3-4%. Well C, despite being a better well compared to stand-alone Well D, had relatively poor fluid recovery. It is likely that due to the simo-frac and the more complex fracture network created near Well C, part of the flowback fluid was recovered in the offset wells, A and B.
Parker County simo-frac
To quantify the benefit from simultaneous fracturing further, we performed a comprehensive study, evaluating public data of simo-fraced wells in Parker County.
We identified 29 groups of simo-fraced wells, based on first date of production in the same month or within 1 month of each other. We compared the production performance of these wells with that of stand-alone wells drilled within 1-1.5 miles from the simo-fraced wells. Thus, each group consisted of three wells: two simo-fraced wells and one stand-alone well.
For about 75% of the cases, the simo-fraced wells and the stand-alone wells were drilled by the same operator. Our analysis is based on production performance alone, provides general guidelines, and does not consider the influence of other parameters, such as local geology, frac design, frac injection rates, number of stages, etc., all of which can impact production performance.
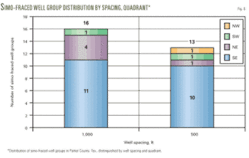
Fig. 6 provides a distribution of the simo-fraced wells by well spacing and quadrant. Of the 29 groups, about 55% (16 groups) included wells spaced 1,000 ft or greater and the rest were spaced about 500 ft. Most of the drilling activity in Parker County has been in the eastern half where the reservoir thickness is relatively higher. Thus, in terms of the location of the wells, almost 72% (21 groups) were in southeast quadrant and 90% (26 groups) were in eastern half of Parker County.
Using Parker County production data for simo-fraced wells, we evaluated the time lag between first sales of simo-fraced and stand-alone wells as a possible factor in the success of the simo-frac over stand-alone wells.
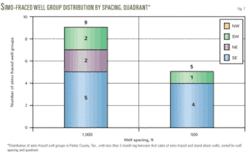
Fig. 7 provides a distribution of simo-fraced well groups with less than 3-month lag between first sales of simo-fraced and stand-alone wells, sorted by well spacing and quadrant in Parker County. About 50% of the well groups fell in this category, with many of the wells drilled on 1,000-ft spacing.
Fig. 8 provides a summary of the production enhancement seen in each of the quadrants of Parker County. We compared peak monthly production, which for most of the cases, is in the first or second month of well life.
The analysis of wells in the southeast quadrant, representing more than 70% of well groups, suggests that wells that had less than 3-months’ lag between the simo-fraced wells and the stand-alone wells had the best success rate to see incremental production and reserves due to simo-fracing.
In the northeast quadrant, the simo-fraced wells outperformed the stand-alone wells, regardless of when the wells were completed. This could be attributed to factors such as variations in frac design or injection rates, as well as regional geology.
Johnson County simo-frac
Johnson County has seen a significant increase in drilling activity in recent years; operators have drilled some of the best-producing Barnett shale wells in this county.
To date, more wells have been simo-fraced in Johnson County than in Parker County. A total of 104 groups of simo-fraced wells was identified in Johnson County based on first date of production in the same month or within 1 month.
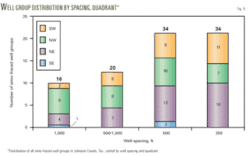
Fig. 9 provides a distribution of the simo-fraced wells by well spacing and quadrant. Of the 104 groups, about 33% (34 groups) had wells drilled on 500-ft spacing. Due to shale thickness and the presence of the Viola limestone in the eastern part of Johnson County, some of the operators began experimenting with 250-ft spacing. About 33% (34 groups) included wells drilled on 250-ft spacing. About 40% (40 well groups) were in northeast quadrant and another 33% (34 groups) were in the northwest quadrant of Johnson County.
The analysis of the Johnson County production data for simo-fraced wells indicated that time lag between first sales of simo-fraced and stand-alone wells was a key factor in the success of the simo-frac compared with stand-alone well performance. The data suggest that wells that had less than 3 months’ time lag between the simo-fraced wells and the stand-alone wells had the best success rate to see incremental production and reserves due to simo-fracing.
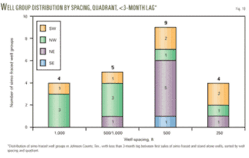
Fig. 10 provides a distribution of the simo-fraced wells with fewer than 3 months of time lag between first production from simo-fraced wells and stand-alone wells, sorted by well spacing and quadrant. Comparing Figs. 9 and 10 reveals that only 20-30% of the well groups fell in this category while the majority of the simo-fraced wells (70-80%) were drilled from 4 months to 3 or more years after the stand-alone well was drilled. We identified a few instances where the stand-alone well was drilled later after the simo-fraced wells by a different operator on an offset lease. In such instances, the simo-fraced wells did better than the stand-alone well.
Fig. 11 provides a summary of the production enhancement of simo-fraced wells over stand-alone wells sorted by well spacing. We compared peak monthly production, which for most of the cases, is in the first or second month of well life. The average production enhancement was 56% for simo-fraced wells over offset, nonsimo-fraced wells.
As expected, the greater the well spacing, the lower the interference and depletion effects. Thus, wells with 1,000-ft spacing had greater incremental gain compared with wells with 500-ft spacing, which did better in turn than wells with 250-ft spacing.
Where the simo-frac wells were drilled more than 3 months after the stand-alone well, the production performance fell significantly and the average IP of simo-fraced wells was less than that of the stand-alone well (about 85% of the stand-alone well). We attribute this to possible interference and depletion effects, which might change the stress profile near the wellbore. Again, wells on 250-ft spacing were most affected by interference and depletion effects and had the lowest IPs compared to stand-alone wells at 80%.
Fig. 12 provides a summary of the production enhancement seen sorted by quadrant for Johnson County. The results indicate an average production enhancement of 53% in simo-fraced wells compared with offset, nonsimo-fraced wells. If a simo-frac well was drilled more than 3 months later, the average IP of the simo-fraced well was 87% of the stand-alone well.
Surprisingly, the lowest IPs of simo-fraced wells compared with stand-alone wells (70% factor) were in the northeast quadrant in Johnson County, which has generally had prolific producing wells. This may be because the presence of the Voila barrier in most of the northeast quadrant has resulted in operators fracturing with high injection rates and there have been excellent stand-alone wells in the area, even without simo-fracing.
Moreover, in some instances, the stand-alone and the simo-fraced wells (which were identified from maps) may not have been completed by the same operator. Again, the contrasting results could be due to differences in frac design, injection rates, number of stages, completion design, etc.
Observations
Simultaneous fracturing produces a more complex web of fractures, increases the surface area created by the frac, and thereby enhances initial production rates and ultimate recovery.
Simultaneous and sequential fracturing in southeast Parker County doubled production rates, on average, compared to a stand-alone well producing from the same leasing unit. The data appear to indicate that simo-fracing results in more enhanced fracture network and production gains compared to sequential fracturing.
The analysis of the data from simo-fraced wells in Parker and Johnson counties showed an enhancement in average peak IP rates of 21% to 55% over stand-alone wells, for wells that had less than a 3-month lag between first sales from simo-fraced wells and stand-alone wells.
On the other hand, if the time lag between first sales from simo-fraced wells and stand-alone wells was longer than 3 months, the simo-fraced wells showed lower average IP rates compared to stand-alone wells. Any material production from the same reservoir sink from interference and depletion effects causes changes in stress profile near the wellbore, which affects the production performance of the simo-fraced wells.
Overall, the analysis suggests simultaneous fracturing is a viable technique for application in the Barnett shale reservoir. For the best chance of success, simultaneous fracturing should be planned in the initial wells that are drilled to develop a new lease.
Acknowledgments
The authors thank the management of Williams Cos. for its support and permission to publish this study. We also thank Kevin McDaniel, student at Missouri University of Science and Technology, for his help compiling the data used in the analysis. Thanks are also due to Mohan Kelkar of University of Tulsa and Harun Ates for their insightful comments.
References
- “Barnett shale information,” Railroad Commission of Texas, Oct. 16, 2008, www.rrc.state.tx.us/barnettshale/index.php
- Carillo, V.G., “Barnett Shale Update,” Platts Shale Developer Conference, Houston, June 2008.
- LaFollete, R., and Schein, G., “Understanding the Barnett Shale,” Supplement to Oil and Gas Investor, January 2007.
- Durham, L.S., “Barnett Shale Play Can Be Complex: Their Success Doesn’t Ensure Yours,” AAPG Explorer Bulletin, September 2007.
- Leonard, R., et al., “Barnett Shale Completions: A Method for Assessing New Completion Strategies,” SPE 110809, presented at the 2007 SPE Annual Technical Conference and Exhibition, Anaheim, Nov. 11-14, 2007.v Daniels, J., Waters, G., LeCalvez, J., Lassek, J., and Bentley, D., “Contacting More of the Barnett Shale Through an Integration of Real-Time-Microseismic Monitoring, Petrophysics, and Hydraulic-Fracture Design,” SPE 110562, presented at the 2007 SPE ATCE, Anaheim, Nov. 11-14, 2007.
- Warpinski, N.R., et al., “Stimulating Unconventional Reservoirs: Maximizing Network Growth while Optimizing Fracture Conductivity,” SPE 114173, presented at 2008 SPE Unconventional Reservoirs Conf., Keystone, Colo., Feb. 1-12, 2008.
The authors
Prasad N. Mutalik ([email protected]) is team leader-reservoir engineering and planning at Williams Cos., Tulsa. He has more than 20 years’ experience in reservoir and production engineering and international business development. Mutalik holds a BS (1985) in chemical engineering from University of Bombay, an MS (1988) in petroleum engineering from University of Alaska, and an MBA (2003) from McCombs School of Business, University of Texas at Austin. He is a registered professional engineer in Oklahoma and serves as a technical editor for ‘SPE Reservoir Engineering and Evaluation’ publication.
Bob Gibson ([email protected]) is district manager for Fort Worth basin (Barnett shale) at Williams E&P Co., Tulsa. He has also served in other management and staff positions in reservoir engineering and operations at Williams, Questar, Vintage Petroleum, Arco, and Cities Service Co. during a career spanning more than 30 years. Gibson was president and independent petroleum engineer at Gibson Lamb Engineering Inc. and R.W. Gibson & Associates Inc. focusing on all aspects of petroleum engineering and industry management practices for nearly 15 years. He holds a BS (1978) in mechanical engineering from Oklahoma State University and completed advanced studies in business and engineering. Gibson is a registered professional engineer in Oklahoma and an active member of SPE, SPWLA, and the Tulsa Geological Society.
