Special Report: Arctic field test offers method for estimating pipeline heave
Pipeline heave in cold environments is influenced by the transition zone between permafrost zone (frozen soil) and nonpermafrost zone (unfrozen soil) as well as the heaving behavior of the unfrozen soil in response to an advancing frost front. Operating a chilled pipeline in the transition zone between soils with different frost-heave susceptibilities faces problems. These transition zones often lead to pronounced differential heave in the pipeline, inducing stresses.
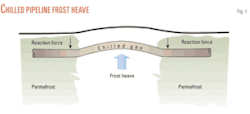
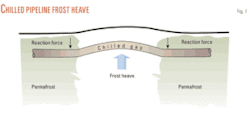
Chilled pipelines have become more necessary as interest in transporting natural gas from northern energy fields has grown. Natural gas transported via pipeline from these fields will encounter both continuous and discontinuous permafrost regions. Chilled gas pipelines prevent permafrost thawing. A new problem, however, arises: the freezing of previously unfrozen soil and associated frost heave (Fig. 1).
Papers presenting the results of the Calgary frost heave chilled pipeline experiment, the Caen, France, chilled pipeline experiment, and the Northwest Alaska Pipeline Ltd., chilled pipeline experiments give a good overview of problems and concerns related to chilled pipelines.1-6 The literature generally accepts that natural gas would be chilled through continuous and discontinuous permafrost zones.
Continuous permafrost zones would have little effect on a chilled pipeline. But operating a chilled pipeline in the transition zone between soils with different frost-heave susceptibilities poses problems. These transition zones often lead to pronounced differential heave in the pipeline, inducing stresses.
Differential heave also leads to questions regarding how much frost heave may occur over the design life of a pipeline and whether it will be within allowable ranges for pipe deformation. These questions in turn govern many design and operational considerations.
This article addresses thermal patterns and pipeline-ground movements found by placing a 105-m long, 0.9-m OD steel pipeline across a transition zone between thawed and permafrost soils, typical of discontinuous permafrost regions. This article also analyzes pipeline deformational behavior and strain induced by soil heave.
The Japan Science and Technology Corporation (JST) operated and funded the full-scale field experiment facility in cooperation with the University of Alaska Fairbanks. The test pipeline is about 10 km from Fairbanks at the old Northwest Alaskan Pipeline Ltd., Fairbanks Frost Heave Facility. The prevalence of discontinuous permafrost regions in interior Alaska, western Yukon Territory, and Siberia make this field experiment of current interest to the worldwide oil and gas industry.
Test facility
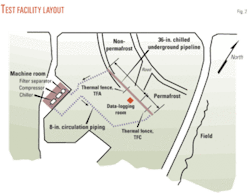
Construction of the 0.9-m OD, 105-m long chilled pipeline test facility, using API 5L X-65 grade steel with 8.5-mm WT, occurred near Chena Hot Springs Road in Fairbanks in December 1999. Fig. 2 shows the general alignment of the pipeline at the test facility. Low, gently rolling hills dominate the terrain to the north of the facility, while to the south the terrain changes into the Chena River floodplain. The facility itself lies in the gently sloping transition between the two terrains.
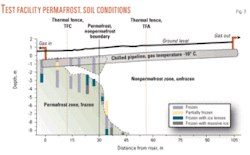
The experimental pipeline rests about 1.8 m below the surface, with backfill of dry sand around and on top of the pipe, including an additional 0.9 m of crushed in situ soil and a thin crown of uncrushed in situ soil. The first 30 m of the pipeline cross shallow permafrost and the remaining section is in unfrozen ground (Fig. 3).
null
Operating conditions
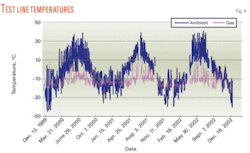
Test pipeline operations started in December 1999 and ended in December 2002. Table 1 summarizes operating conditions. Fig. 4 shows gas temperature fluctuations inside the pipeline and surrounding air temperature.
Instrumentation included installation of 150 thermistors, 40 strain gauges at 11 locations along the pipeline, 24 heave rods welded to the top of the pipeline, 5 heave gauges installed below the pipeline, and several other types of soil settlement detection devices. Monitoring of heave rods occurred once every 2 weeks with a rotating laser-leveling device. Three automated data-acquisition systems recorded temperatures and strains twice daily.
null
Temperature monitoring
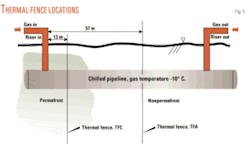
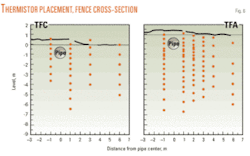
One hundred thermistors located in two of the three thermal fences monitored changes in the soil system (Figs. 5-6). Thermal fence A ran through the initially unfrozen zone and thermal fence C ran through the shallower permafrost region.
Thermal fence A, 58 m from the inlet riser, contains six thermistor strings with depths ranging from 0.14 to 8.14 m (elevation of 1.13 to –6.87 m) beneath the surface. Thermistor spacing ranged from 0.25 to 1.0 m with the closer spacing occurring near the pipeline. Thermal fence C, located 13 m from the inlet riser in the permafrost zone, contains four thermistor strings with depths ranging from 0.04 to 7.00 m (elevation 0.54 to –6.42 m) beneath the surface. Thermistor spacing ranged from 0.5 to 1.0 m. Nine thermistors ran along the outside of the pipeline to monitor temperature variation of the pipeline itself.
null
Displacement, strain
Monitoring vertical displacement of the ground surface required placing six heave plates on the ground. Twenty-four heave rods (HR) welded directly to the top outer surface of the pipeline between 0 and 52.7 m from the inlet riser monitored movement of the pipeline. The highest concentration of heave rods lay near the assumed transition zone.
Two independent benchmarks referenced elevation. Each consisted of 7.6-m long, 16 mm steel rebar. Benchmark installation in permafrost to the south of the pipe placed about 6.6 m underground and about 1 m above ground. A 50-mm OD PVC pipe surrounded the upper 3 m of each benchmark to reduce active layer effects. A 150-mm OD PVC pipe placed over the above-grade portion of each benchmark served as a protective casing. The assumed reference elevation for analysis purposes was 1 m.
Monitoring induced strain used 40 strain gauges attached to the pipe surface.
Thermal analysis
In the permafrost zone (TFC), soil remains frozen through the year, except for the top 1 m, which becomes unfrozen in the summer. In the nonpermafrost zone (TFA) the thaw depth extends deeper in the summer but all soil remains frozen in winter.
A 2D thermal simulation model conducted numerical simulation for the full-scale experiment. Before the 2D thermal simulation, simplified 1D simulation determined adequate parameters for thermal simulation.
Field data matched well with both the simulation results and analytical solution, implying that these methods of simulation or analysis could be applied to design. The parameters used (Table 2) provide a good reference for the actual design stage.
Pipeline movement
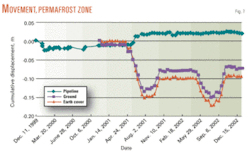
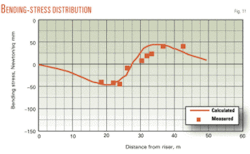
Heave rods (HR) welded directly to the top of the pipeline monitored pipeline movement. HR-1 stood 8.5 m from the inlet riser and HR-24 52.7 m away. Pipeline vertical displacement is relatively large in the nonpermafrost zone. The largest displacement occurred at HR-22 (45 m from the riser), with an incremental displacement during 3 years monitoring of about 0.2 m. The minimum movement within the permafrost section measured 0.049 m, resulting in a differential heave of 0.148 m. Maximum heave occurred next to the permafrost-unfrozen transition and not solely in the deep permafrost zone. Pipe-bending stress assumed an S-shaped distribution, with a maximum stress measuring 50 Newton/sq mm.
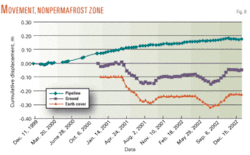
Fig. 7 shows chronological displacement of pipeline and ground surface together with the change of earth cover in permafrost zone. Fig. 8 displays the same in a nonpermafrost zone.
null
Pipeline analysis
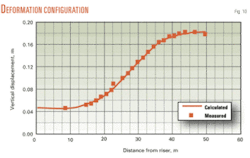
The field experiment showed greater upward displacement in the nonpermafrost sections than in the permafrost section, causing an S-curve shaped pipeline deformation near the boundary between the two. Chilled-pipeline design requires analyzing pipeline deformation and induced stress near permafrost and nonpermafrost boundary using the proper structural mode.
Common practice models a pipeline as a beam supported by elastic springs. A similar approach allows analysis of pipeline deformation near the permafrost and nonpermafrost boundary.
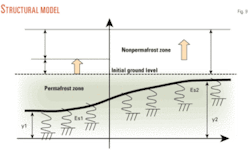
Fig. 9 shows the structural model of chilled pipeline near a permafrost and nonpermafrost boundary. In the model, δ1 and δ2 represent upward displacement at permafrost section and nonpermafrost boundary section respectively. Greater frost heaving increases δ2.
Pipe-soil interaction is modeled by elastic springs (Es). The accompanying equations calculate chilled gas pipeline deformation due to frost heave. Applying the structural model to an actual design stage of a chilled gas pipeline requires appropriate values for Es1 and Es2. Multiple parameter studies found Es1 = Es2 = 300,000 Newton/sq m provides good agreement with the pipeline deformation shape and pipe-bending stress distribution obtained in the field experiments (Figs. 10-11).
null
Acknowledgments
This research project was operated and funded by the Japan Science and Technology Corp. in cooperation with the University of Alaska Fairbanks.
References
Based on presentation to the 7th International Pipeline Conference, Calgary, Sep. 29-Oct. 3, 2008.
The authors
Toshiya Tanaka ([email protected]) is a manager at JFE Engineering Corp., Yokohama, Japan. He holds BS (1982) and MS (1984) degrees in civil engineering from Kyushyu University, an MS (1994) in petroleum engineering from Stanford University, Palo Alto, Calif., and a PhD (2004) in civil engineering from Kyoto University. He is a member of the American Society of Mechanical Engineers and Japan Society of Civil Engineers.
Scott Huang ([email protected]) is professor of geological engineering at the University of Alaska, Fairbanks. He holds a PhD (1981) from the University of Missouri-Rolla. He is a member of the Association of Engineering Geologists.
Satoshi Akagawa ([email protected]) is a professor at the graduate school of engineering at Hokkaido University. He has also served as chief engineer at the research center of Shimizu Corp. He holds a PhD of environmental science from Hokkaido University. He is a member of the Japanese Geotechnical Society, the Japan Society of Civil Engineers, and the Japanese Society of Snow and Ice.
