VOC EMISSIONS—2 (Conclusion): Field evaluations verify VOC emission control options
Field evaluations quantified the benefits and costs of various alternatives for complying with government regulations for controlling volatile organic compound (VOC) emissions in Colorado.
This concluding part of a two-part series describes field evaluations Noble Energy Inc. ran in its operated oil and gas production facilities in Northern Colorado. Part 1 (OGJ, Aug. 25, 2008, p. 37) discussed the regulations, typical operations, and study objectives.
The study evaluated several types of separators, control systems, and identified multiple cost-effective ways to meet the regulatory requirements and tailor them to site-specific factors. The field evaluation included:
- Comparing VGR, dual coil, and HLP separators. Part 1 contains schematic diagrams and descriptions of all three separators.
- Evaluating enclosed flare designs.
- Testing surge bottles and slug catchers.
- Testing vapor-recovery units.
Separator comparison
Noble began its field evaluation of the three separator configurations (VGR, dual coil, and HLP) in December 2006. Its objective was to determine the performance differences among the separators in terms of emission controls, fuel consumption, and economics. The company then used these results to select separators for installation at new production sites.
Side-by-side tests of dual coil and VGR separators, both with and without wells on plunger lift, began in February 2007.
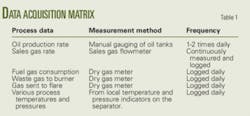
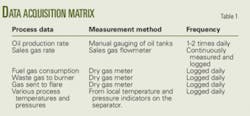
The evaluations involved daily collection of process data and recording them manually in field data sheets. Table 1 summarizes the data collection methods and frequency.
Also collected were hydrocarbon stream samples for analysis. The evaluation analyzed the periodic grab samples of separator liquids, sales gas, sales oil, and flared gas for hydrocarbon composition during each test run, which generally lasted about 1 week. The analysis also measured the heating value of the gas samples.
Controlling the conditions in each separator for comparing performance among separators was the biggest challenge encountered in the field testing. It was impossible to test each separator simultaneously with the same feed stream. Instead, the evaluation required testing the separators in sequence and considering the effects of well production rates in interpreting the oil and sales-gas production data from each separator. For example, the production from a well tends to decline over time, so that the interpretation required normalizing the production rate from each separator to a common well production rate.
Production rate variability was a problem because it limited measurement accuracy. For example, daily tank-gauged oil production rates are subject to many variables and generally cannot accurately differentiate the small variations in production rates between separators. Finally, the extreme cold weather in early 2007 created problems such as condensation in vapor lines that interfered with dry-gas meters and freezing liquids that plugged production and sales gas lines.
Field data showed that the VGR separator substantially reduced the flared gas, as determined from gas meter measurements and the percent of feed hydrocarbons in the sales gas or sales oil streams not burned as fuel gas or flared. The VGR also burns some flash gas as fuel, thereby reducing the need for using sales gas as fuel. In addition, the VGR reduced the VOC emissions flared.
In evaluating VOC control, the field tests also verified separator economics to ensure that they did not adversely affect overall production revenues, for example by shifting hydrocarbons from oil sales to lower value gas sales.
Raw field test data showed that in the first test, the VGR generated less sales oil and gas revenue than the dual-coil separator, but in the second test, the VGR provided more revenue. The oil and gas production rates from all wells were the dominant factor for these results.
After normalizing field data on a per pound of hydrocarbon produced by all wells, the evaluation found that the VGR generated 1.0% less revenue than the dual coil in the first field test and 0.8% more revenue in the second test. The differences in the nonnormalized oil production rates for both tests and in the nonnormalized gas production rates in the first test had less than 95% confidence intervals for the difference in population means, so that these differences were not statistically significant.
In conclusion, field data showed that any differences in the economic performance were too small to determine directly in the field. Additional conclusions were:
- In both field tests, the VGR provided more produced hydrocarbons for sale as oil or gas. On a mass basis, the VGR averaged 99.1% of hydrocarbons sold as oil or gas compared with 98.4% with the dual coil.
- In both field tests, the VGR reduced the gas generated in the storage tank and sent to the flare by about 1.0 Mscfd (43%).
- In both field tests, the VGR reduced fuel consumption by about 0.7 Mscfd (71%).
- Analytical samples collected during the evaluation showed no significant difference in sales gas or oil composition between the VGR and the dual coil.
- The VGR produced slightly richer heating value (4.5%) flare gas on average, but individual samples varied greatly.
- The VGR and dual-core separators had no major operational problems during the field evaluation.
Enclosed flare
The common use of burners or enclosed flares is to control storage-tank vapor emissions at sites with low production, such as those producing less than 10 bo/d.
Noble’s Weld County, Colo., production sites have more than 700 20-in. diameter burners installed.
Burner capacity limitations may require installation of multiple units at sites with wells producing at higher rates, so that this study evaluated the development of cost-effective larger capacity burners, as well as development of a surge bottle for extending the capacity of the 20-in. burner by reducing peak flow rates.
A typical 20-in. burner has an estimated 14.0 Mscfd capacity at 1 psig inlet pressure. If flash-gas peak rates exceed this rate for more than 1-2 min, pressure builds on the storage tanks and eventually pressure relief valves may vent gas directly to the atmosphere.
Extensive testing of a larger 36-in. diameter burner took place during February and March 2007. This prototype burner initially had problems with severe vibration at certain inlet pressures during oil production cycles. One problem was with visible smoke.
Vibration or fluttering indicates flame instability at the burner tips. A shortage of air causes the flame alternately to burn and extinguish in rapid pulses and may cause this instability. A combustion expert who witnessed the field tests recommended installation of commercially available venturi burner tips and other changes for getting more air into the burner.
The challenge was to get enough air to mix with very rich gas that is at or near its dewpoint. The problem was even more difficult to solve in this application because the inlet gas did not have sufficient pressure to use as a driving force to draw in air to mix with the gas. In addition, the test site did not have the electricity needed for running an air blower. The recommended changes likely would have cost more than allowed by the project goals.
Shortly after testing the 36-in. burner, the company identified the availability for testing of a 48-in. diameter, enclosed-flare demonstration unit. Given the minimal costs to the project for testing the larger burner, its immediate availability, and its potential to process more gas because of the larger diameter, the project team moved forward with the test. Fig. 4 in Part 1 shows the 48-in. burner.
Testing began in March 2007. The first tests revealed several problems. First, the 48-in. burner vibrated, although not as severely as the 36-in. burner. Second, the stack temperatures exceeded acceptable temperatures for the galvanized stacks used on the burners. In effect, the burner configuration released too much heat for this size of enclosed flare.
This burner requires careful management of the gas rate and heat release to prevent overloading the unit. In addition, the burner occasionally vented faint visible smoke at low inlet pressures, which most likely may occur at either startup or shutdown of an operational cycle and is not acceptable from an air quality perspective.
The vendor made several modifications to address these problems and delivered a revised prototype later in March 2007. The modifications included a reconfigured manifold to reduce the maximum firing rate and a refractory blanket lining inside the galvanized metal stack. These modifications provided the required temperature protection for maximum firing rates with metal galvanized stacks while keeping unit costs lower than alternative solutions such as stainless steel or stainless steel-lined carbon steel stacks.
The refractory blanket design had the drawback that any gaps in it could lead to a failure of the galvanized metal stack. To address this concern, the design specified a minimum 1-in. overlap at each heat blanket seam to protect the metal outside the heat blanket. The reconfigured burner manifold and the refractory liner addressed the high-temperature problems. Later units changed to refractory blanket-lined carbon steel stacks as a more economical steel stack supplier was identified.
To address the vibration problems, the vendor placed spring-loaded valves in the burner manifolds to limit flow to a number of burner manifolds that is proportional to the inlet pressure and inlet flow rate to the flare. Coupled with adjustments to damper settings on the air intakes, these changes effectively solved the vibration problems.
The best solution identified for the smoking problem was installation of a regulating valve that only allows vapors to flow from the storage tank to the flare after the vapors reach a minimum pressure. Tests determined the optimum check valve and check-valve orientation for obtaining this pressure.
Surge bottles, slug catcher
As described previously, wells at many of Noble’s sites flow intermittently with the aid of wellbore plunger lift. Fluctuations in the fluid delivery rate to the separation equipment present an additional difficulty for controlling emissions because the equipment design needs to address both the peak as well as average flow rates.
Several strategies may mitigate the negative effects of flow variations on flashing losses. For example, one may install a slug catcher between the well and separation equipment or a surge bottle with appropriate controls between the separation equipment and atmospheric storage tanks.
The slug catchers and surge bottles provide a buffer for the separation and control equipment and reduce capital costs in cases where the separation and control equipment cannot otherwise handle the peak flow rate.
Surge bottle tests
At many Noble production sites, flow rates cycle as low volume wells with plungers go on and off line. The fluctuation in feed flow rates makes separation equipment operations more difficult.
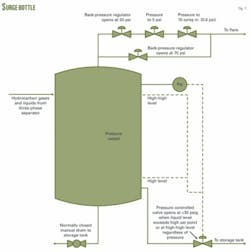
Adding a vertical pressure vessel, such as a surge bottle (Fig. 1), between upstream separation equipment and the atmospheric storage tank can reduce the amount of vent gas to be treated and thus reduce the size and cost of the downstream control equipment, for example the flare.
The surge bottle also provides additional oil revenue because a greater portion of the hydrocarbon feed remains in the liquid phase.
Liquids and gases from upstream separation equipment enter the pressure vessel. Liquids and gases accumulate in the pressure vessel during the well cycle. Once pressure in the surge bottle exceeds a predetermined high-pressure set point, vapors from the pressure vessel flow through a control valve at a controlled rate until the vessel’s pressure decreases to a predetermined low-pressure set point. At the set point, the control valve stops the flow.
Liquids produced during a well cycle remain in the surge bottle while pressure in the vessel decreases as a control valve allows the gas to vent. This prevents high-pressure liquid from flashing to the storage tank, which results in a lower peak rate and less vapors formed during the cycle in the storage tank. Additionally, the oil production rate increases because more hydrocarbons remain in the liquid phase and a decreased vent-gas volume strips out less heavier hydrocarbons.
Control valves prevent liquid discharge from the surge bottle unless the pressure decreases below a predetermined set point. The control set up maintains a liquid seal in the bottom of the vessel that prevents vapors at the bottom of the vessel from going to the storage tank. For liquids to drain from the surge bottle to the storage tank under normal operating conditions requires a liquid level in the surge bottle greater than the level set point and a pressure in the surge bottle lower than the pressure set point.
When the liquid reaches the high-high liquid level in the bottle, a second, high-high level control setting allows the liquids to drain from the bottle to the storage tank regardless of pressure in the bottle. This prevents the surge bottle from overfilling with liquid.
Pressure controls that allow vapor and liquid to leave the surge bottle must operate at set points about 10 psi apart; therefore, an operator must select settings carefully to obtain full benefits from the surge bottle.
Field testing of prototype surge bottles modified from existing pressure vessels showed that the surge bottle capacity must hold the entire production volume from a given well cycle for best performance in reducing or preventing venting from the storage tank. Additionally, the flare must bleed pressure off the surge bottle before the surge bottle fills full of liquid and before the pressure exceeds the back-pressure relief valve set-point pressure.
The field testing optimized the control system (Fig. 1) for maximum performance with simple controls that are readily available in oil field service supply shops. These controls allow for a fail-safe operation in the event that the feed exceeds the surge-bottle capacity.
As with other oil field service equipment in these locations, the surge bottle design allows for unattended operation and does not require electricity. The volume of the surge bottle limits the oil production peak rate that the bottle can handle effectively. Transportation, installation, and servicing requirements determine the practical limitations for the surge bottle size.
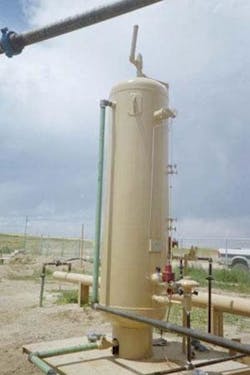
Repeated field tests of the 36-in. diameter, 8-ft seam-to-seam high surge bottle (Fig. 2) showed that 2.5-3.0 bbl/well cycle (15-30 min) was the maximum oil production that the vessel could contain successfully without exceeding the set point that relieves gas pressure in the surge bottle to the storage tank.
Variation in well cycle production rates were the main cause for changes in the capacity of the surge bottle. Control tests showed that use of the surge bottle reduced the vapor formation peak rates.
Trimeric estimated with simulations the amount of oil per cycle that the surge bottle could hold and found good agreement with the field data. The simulations predicted the effect of operating temperature, flare capacity, duration of oil production per cycle and composition of gas remaining in the surge bottle from the previous cycle on the capacity of the surge bottle. As shown in Table 2, the base case showed that the surge bottle could hold 2.7 bbl/well cycle that lasted for 30 min. Varying conditions studied in the simulations gave a range of 2.0-4.1 bbl/well cycle as the maximum surge bottle capacity.
Process simulations also estimated the economics of using a surge bottle. In addition to allowing the sizing of VOC emission control devices for smaller peak gas flows, the surge vessel also increases oil production.
Trimeric ran process simulations for three field test sites to estimate the economics of the incremental oil production resulting from the surge vessel. The simulations were for several feed compositions both with and without a surge bottle between the separation equipment and the atmospheric storage tank. As with other simulations, Trimeric used WinSim Design II v.9.43 and the Peng Robinson equation of state as the thermodynamic model.
For the three sites, the simulation indicated that oil production would improve by 2-3% and result in short economic payback periods of 1 year or less.
Slug catcher tests
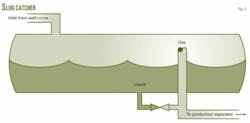
Another method for reducing peak flows and associated design requirements for VOC control employs a slug catcher upstream of the separators. Early in 2007, Trimeric and Noble engineers began discussing the concept and preparing engineering drawings for a slug-catcher prototype. The prototype slug catcher is essentially a horizontal pipe sized to collect the volume of the maximum slug size. The designed prototype has a 1-bbl liquid slug capacity (Fig 3).
Produced oil, water, and gas enter one end of the slug catcher and gravity separates out the liquid and gas. Gas flows out into the exit pipe while liquids remain in the slug catcher. An external control valve lets the liquids drain slowly into the separator to reduce liquid surging, thereby reducing the flash-gas peak rate.
The study had a prototype slug catcher fabricated and delivered to a test site in August 2007; however, it delayed plans for testing the slug catcher to allow accelerated testing and development of the surge bottle.
A potential drawback of the slug catcher is a high cost because the slug catcher must have a rating based on the high-pressure inlet conditions and requires a flanged end for maintenance access. The slug catcher also is upstream of the inlet three-phase separator, so that water freezing during cold weather may cause operational problems that could lead to additional costs for insulation and heat tracing. One key benefit of the slug catcher is that the controls are very simple.
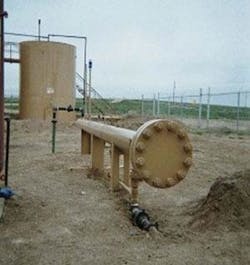
Fig. 4 shows the prototype slug catcher, installed at a site with a current peak production rate of 2-3 bbl/well cycle. This rate is too high for testing the 1-bbl capacity slug catcher. Project personnel are monitoring the natural production decline at the site and testing is planned when the peak production rate drops to about 1 bbl/cycle.
Vapor recovery unit tests
The study evaluated two vapor-recovery systems in detail.
The first (Fig. 5 in Part 1) was a packaged two-stage reciprocating compressor. In the initial installation configuration, all low-pressure gas from the low-pressure separator of the HLP flashed to the storage tank and all vapors from the storage tank entered Stage 1 of the VRU. Noble has more than 100 of these units in service at its Weld County production facilities. The study’s goal was to increase the throughput capacity of these VRUs.
The goal was met by installing a surge bottle and sending vapors from the surge bottle directly to the second stage of the compressor. This reduced the load on the first stage in two ways. First, the low-pressure gas from the HLP that would have gone to the storage tank and then to Stage 1 now went from the surge bottle directly to Stage 2. Secondly, lower pressure liquid drained from the surge bottle to the storage tank, so that flashing the oil to the storage tank generated fewer vapors.
The peak flow capacity of the VRU increased from 17 Mscfd in the original configuration to 32 Mscfd with the surge bottle online and the surge bottle vapor routed directly to Stage 2 of the VRU.
Interestingly, the average amount of cumulative vapors collected by the VRU in 24 hr decreased to 6.0 Mscfd with the surge bottle online from 7.5 Mscfd in the original configuration. The reduction in gas recovered with the surge bottle online indirectly confirms that the oil production rate increases with the surge bottle, as would be expected by adding an additional stage of pressure drop for flashing oil down to atmospheric pressure.
The second VRU evaluated in the project was a packaged unit that was integrated with a three-phase separator with two stages of pressure drop (Fig. 6 in Part 1).
The VRU portion of the unit had a single-stage compressor with two separate sources contributing to its inlet low-pressure gas. The first source was vapor from the low-pressure separator. In fact, this system had a design for handling vapors from multiple two-stage separators so that gas from other low-pressure separators at the site could route to the single VRU at the site. This approach improves the potential economic performance and payback period for the system.
The other feed stream to the compressor was the storage-tank vapors after an eductor that used glycol as the motive fluid raised the vapor pressure from near atmospheric pressure (<1 psig) to about 25 psig.
This VRU was more complex than the first VRU and other VOC control equipment evaluated in this study. The testing encountered an unacceptable number of system failures and reliability problems with the two systems of this type evaluated for several months.
The manufacturer continues to develop and commercialize this system. This VRU system could have favorable economics if the system attains acceptable reliability and if the operation can ensure a favorable gas price and the ability to sell the rich gas recovered by the VRU on a per-btu basis instead of on a per-volume basis.
The most optimal scenarios indicate possible payback periods of less than 1 year.
