New method yields MEG injection rate
This article reports on development of a shortcut method that minimizes the calculation steps for obtaining the inhibitor concentration and injection rate required to depress hydrate formation to a desired temperature.
Several thermodynamics models are also available that yield inhibitor concentration and injection rate, but their calculations may require rigorous computer solutions.
This article presents four diagrams to predict the required weight percent of monoethylene glycol (MEG) in the rich solution and the flow rate for the desired depression of the hydrate formation temperature (HFT) for natural gas streams. These diagrams are generated for a natural gas with relative density of 0.6 at pressures of 3, 5, 7, and 9 MPa and are applicable to wet gas temperatures of 20°, 30°, 40°, and 50° C.
In order to extend the applications of these charts to wider ranges of natural gas mixtures with specific gravities of up to 0.8, the article provides two generalized correction factors. These correction factors are based on rigorous computer simulation. The accuracy of this shortcut compares favorably with rigorous computer simulation results obtained from commercial process simulators; it yields excellent agreement.
Preventing hydrates
Gas hydrates are a well-known problem in natural gas processing and transmission pipelines when natural gas and water exist at specific conditions. This is particularly true at high pressure and low temperature.
Fundamentally, there are four ways to prevent hydrates from forming:
- Reducing the pressure below the hydrate-formation pressure for the given temperature.
- Maintaining the temperature of the gas above the hydrate-formation temperature for the given pressure.
- Reducing the water vapor dewpoint of the gas below the lowest operating temperature (dehydration).
- Injecting alcohols or glycols into the gas stream to move the hydrate-formation conditions to lower temperatures and higher pressures (inhibition).
The first and second methods may not be practically possible for economic or operational reasons or both. The choice to inhibit hydrate formation, the fourth method, or to dehydrate, the third method, is based on economic and operating parameters that are not addressed here.
The method to be discussed here specifically relates to the inhibition method to prevent formation of hydrates in natural gas streams.
When an inhibitor is used for hydrate depression, there are three possible phases into which the inhibitor may distribute:
- The aqueous phase, in which the hydrate inhibition occurs.
- The vapor hydrocarbon phase, in which the inhibitor may be lost.
- The liquid hydrocarbon phase.
Depending upon the temperature and pressure, all three fluid phases may be present, or either the vapor or liquid hydrocarbon may be missing. No matter the fluid state, the inhibitor in the aqueous phase has the inhibition effect.
The importance of the calculations to determine the required inhibitor concentration in the aqueous phase and inhibitor mass flow rate to achieve the desired HFT depression has prompted development of several thermodynamics models. All of them provide guidelines to help users forecast gas-hydrate formation conditions for most systems containing hydrate-forming molecules in the presence of inhibitors.
Hammerschmidt proposed the first empirical equation to find the required concentration of an inhibitor in an aqueous solution for lowering the hydrate formation temperature.1 Nielsen and Bucklin proposed an improved equation of Hammerschmidt’s equation applicable only for methanol solutions, for concentrations up to 0.8 mole fraction methanol in the aqueous phase and temperatures down to 165 K.2
To improve the prediction over a larger range, Carroll proposed a modified version of the Nielsen-Bucklin equation to take into account inhibitor concentration by including the water activity coefficient.3 Moshfeghian and Maddox proposed a correlation to predict the concentration of inhibitors at high pressure and high concentration of inhibitor.4 This correlation includes the water-activity coefficient and enthalpy of hydrate formation per hydrate number.
Portability and simplicity are advantages of these correlations because they can be solved with a simple calculator. It should be noted that process simulation packages such as HYSYS or gas processing software like GCAP and EzThermo are also available for predicting the effect of inhibitors on hydrate formation.5-7
In this work, four graphs predict MEG concentration to prevent hydrate formation. These graphs are based on rigorous computer simulation that used HYSYS. Several simulations determined the effect of MEG concentration in the aqueous phase on the depression of the HFT. These simulations were for gas compositions having relative densities of 0.6, 0.65, 0.7, 0.75, and 0.8 at pressures of 3, 5, 7, and 9 MPa, each saturated with water at temperatures of 20°, 30°, 40°, and 50° C.
Simulations
Fig. 1 shows the process flow for computer simulation used to develop the correlations of hydrate inhibition presented in this study. A feed stream of saturated wet natural gas mixes with a stream of MEG solution. For all of the simulations the injected MEG composition is 80% MEG and 20 wt % water. The mixed stream temperature is decreased with the HYSYS cooler operation to meet the minimum temperature of system studied. The cooled stream is then separated with the three-phase separator operation.
For these simulations, the cooler’s outlet temperature is set at –30° C., producing a gas stream leaving the three-phase separator with a hydrocarbon dewpoint of –30° C. This temperature has no effect on the hydrate-formation temperature calculations but may cause a small change in the concentration of MEG in the outlet aqueous phase.
Five natural gases with relative density ranging from 0.6 up to 0.8 in increments of 0.05 were used to develop the required charts.
Obtaining a representative set of operating conditions over which to test the correlation the temperature and pressure of each feed stream involved varying from 20° to 50° C. in 10° C. increments and 3 to 9 MPa in 2 MPa increments, respectively. In all of the simulations, we varied the flow rate of MEG solution to obtain a wide range of MEG concentration in the aqueous phase. Then, for each MEG solution rate, we calculated the MEG concentration in the aqueous phase and the HFT depression.
Base chart
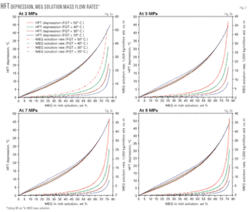
We developed the base charts, using a gas having a relative density of 0.6 with pressure and temperature variations as discussed previously. Fig. 2 plots the simulation results of MEG concentration in aqueous phase (i.e., rich solution), depression of the HFT, and MEG solution mass flow rate for pressures of 3, 5, 7, and 9 MPa, respectively.
These charts can determine the required MEG concentration and flow rate for a desired HFT depression for a gas with a relative density 0.6 at water-saturation temperatures between 20° and 50° C. for pressures ranging from 3 to 9 MPa. For pressures between the curves presented, linear interpolation can be used.
For many natural gas streams, the gas relative density may vary from 0.6 to 0.8. Therefore, the following section presents methods to extend the use of these charts for gases with relative densities up to 0.8.
Generalized charts
Extending the proposed charts (Fig. 2) to other natural gases with relative density of up to 0.8 requires use of two correction factors (see accompanying equation box).
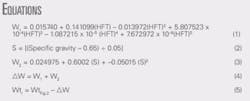
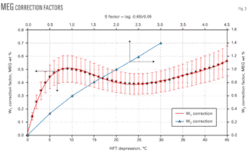
The first one, W1 (Equation 1), is the correction factor for the MEG concentration in the aqueous phase. This factor takes into account different HFT depressions between the base relative density of 0.6 and the other gas relative densities of 0.65 up to 0.8. Fig. 3 can yield this correction factor for pressures of 3 to 9 MPa.
Note the values of W1 shown in Fig. 3 are the arithmetic average of correction factors for pressures of 3, 5, 7, and 9 MPa. The 20% error band shown in this diagram reflects the maximum error that is not greater than 0.1 wt % MEG concentration. Equation 1 may be used instead of Fig. 3.
The second correction factor, W2, corrects the MEG concentration resulting from the difference of MEG concentrations in the aqueous phase at different gas specific gravities. We developed this factor using the five gas compositions having relative densities ranging from 0.6 up to 0.8. Obtaining W2 requires first calculating the factor S with Equation 2.
Once the value of S is calculated, Fig. 3 determines the weight percent correction factor, W2. Equation 3 may also be used instead of Fig. 3.
For gases with specific gravities ranging from 0.65 up to 0.8, the revised MEG concentration can be obtained as follows:
- Obtain the base MEG concentration from Fig. 2 (WtFig. 2) using linear interpolation for pressures between those presented in the figures.
- Determine the correction factors (W1) from Fig. 3 (or Equation 1) and (W2) from Fig. 3 (or Equation 3). The revised MEG concentration (Wtr) is then calculated with Equations 4 and 5.
Evaluation of method
To demonstrate the application of the proposed charts, consider Example 6.6 in Vol. 1 of Gas Conditioning and Processing.8
This example states that 3.5 × 10⁶ std. cu m/day of natural gas leaves an offshore platform at 40° C. and 8,000 kPa. The hydrate temperature of the gas is 17° C. The gas arrives ashore at 5° C. and 6,500 kPa.
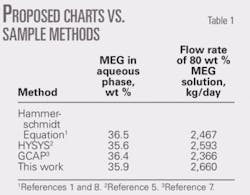
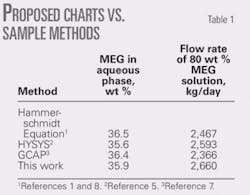
The associated condensate production is 60 cu m/106 std. cu m. The amount of 80 wt % MEG inhibitor required to prevent hydrate formation in the pipeline is to be calculated. It should be noted that in this example, the composition (or relative density) of natural gas is not given; therefore, demonstrating the use of these charts requires a relative density of 0.6 be assumed. The feed-gas pressure is 8 MPa; so a linear interpolation between 7 MPa (Fig. 2c) and 9 MPa (Fig. 2d) is applied. Table 1 presents the results.
Table 1 shows a comparison between results of these charts and those based on the Hammerschmidt equation, HYSYS, and GCAP for this example.1-2 7-8
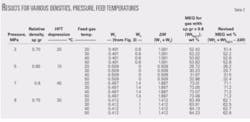
For gases with relative densities 0.65 and greater, the required MEG concentrations in the aqueous phase are predicted at different pressures, feed-gas temperatures (FGT), and specified HFT depression.
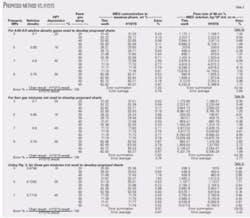
Specified conditions and the predicted correction factors W1, W2 and accordingly the required MEG concentrations in the aqueous phase appear in Table 2 for these gases. Application of these corrected MEG concentrations predicts the required MEG flow rates (Table 3a). Table 3a also shows a comparison between the results of this proposed shortcut method and HYSYS.
To demonstrate the accuracy of the proposed method further, we have changed gas compositions from those used to generate these charts. These new gas compositions predict the required MEG concentration and flow rate. Tables 3b-3c show the charts results and their comparisons with results of HYSYS.
In all of these cases, the charts give good agreement with those predicted by HYSYS. The analysis of the results obtained indicates that the required MEG weight percent in the aqueous phase will decrease by increasing the gas relative density. The MEG weight percent obtained for gas with relative density 0.6 can therefore be used for gases with higher relative density if a more conservative estimation is required.
Acknowledgment
The authors thank Frank W. Jarrett for his helpful editing of the article.
References
- Hammerschmidt, E.G., “Formation of gas hydrates in natural gas transmission lines,” Ind. & Eng. Chem., Vol. 26 (1943), p. 851.
- Nielsen, R.B., and Bucklin, R.W., “Why not use methanol for hydrate control,” Hydrocarbon Processing, Vol. 62, No. 4 (April 1983), p. 71.
- Carroll, J., “Natural Gas Hydrates, A Guide for Engineers,” Houston: Gulf Professional Publishing, 2003.
- Moshfeghian, M., and Maddox, R.N., “Method predicts hydrates for high-pressure gas stream,” Oil and Gas Journal, Aug. 30, 1993. p. 78.
- HYSYS, Flowsheet Simulation Software, Ver 3.1, Hyprotech Ltd., Calgary, Alta., 2001.
- GCAP, Gas Conditioning And Processing Program, 8th Edition, Norman, Okla.: J.M. Campbell & Co., 2005.
- Moshfeghian, M., and Maddox, R.N., EzThermo, In-House Professional Oil and Gas Processing Calculations, 2007.
- Campbell, J.M., “Gas Conditioning and Processing,” Vol. 1, The Basic Principles, 8th Edition, Second Printing; Norman, Okla.: J.M. Campbell & Co., 2001.
The authors
Mahmood Moshfeghian ([email protected]) is a consultant and instructor at John M. Campbell & Co., Norman, Okla. Before joining JMC, he was professor of chemical engineering at Shiraz University, Iran, where he served as department head and associate dean of research in the college of engineering. He was also dean of the college of engineering in the Persian Gulf University. He was previously professor of chemical engineering at the University of Qatar and a senior research scientist at the Kuwait Institute for Scientific Research. Moshfeghian holds BS, MS, and PhD degrees in chemical engineering from Oklahoma State University. He is a senior member of AIChE.
Roohallah Taraf ([email protected]) is a process engineer at Pars Oil & Gas Co., Tehran, Iran. He holds BS (2003) in chemical engineering from Tehran University and an MS (2005) in gas processing and transmission engineering from Petroleum University of Technology.
