Cost shift signals changes in energy investment, use
Industrial energy costs have increased recently relative to industrial construction costs in a shift that will affect energy investment, production, and use.
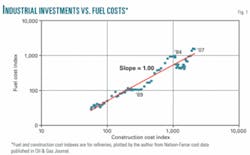
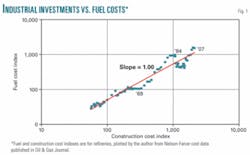
For at least 4 decades, energy and construction costs have changed at nearly identical rates, as shown in the trend line in Fig. 1, which plots a data series dating back to 1930. The relative increase in energy costs apparent in the 2007 data point is only the second major upward departure from the trend to have occurred during the period.
In an earlier article, the author pointed to the inevitability of this shift and described a wide range of responses it would induce.1 Among those responses are the application of significantly more-expensive exploration and production technologies, application of advanced enhanced oil recovery processes, and major increases in the production of heavy oil.
The recent rise in the cost of energy relative to the costs of industrial construction would be expected to encourage construction of new energy-producing and processing facilities. Higher retail energy costs for gasoline and electricity should also encourage new energy-related investments in the US.
This real surge in new domestic energy-producing investments is not apparent today, except perhaps for petroleum drilling. While environmental and regulatory constraints are major factors in this delay in energy-production investment, the long-term correlation of industrial construction with industrial energy costs also has been an important limit on investment in energy-producing facilities.
The data
The cost of energy for industrial uses and industrial investment costs correlate on a 1:1 ratio since 1930, as illustrated in Fig. 1.
The conveniently available data for this plot are the Nelson-Farrar Refinery Fuel Index and Refinery Construction Index tabulated in Oil & Gas Journal.
The computed slope for the plot is 1.00, although the fuel index shows considerable fluctuation relative to the construction index.
The author has previously published this curve in OGJ with data to 1992, among other observations regarding petroleum supply and price.1 The 1:1 ratio of energy to investment cost has continued with peaks in industrial energy prices in 1984 and now in 2007. Between these two peaks, there was a prolonged apparent depression of industrial energy prices relative to investment costs.
The slope was calculated with the Excel Solver with the following equation:
1) log (energy cost index) = n log (investment index) + k
The Excel Solver calculated the two correlating parameters n and k to minimize the error associated with calculated industrial energy costs using the following equation applied to each year of the data:
2) error = (log (energy index calculated) – log (energy index tabulated))2
The above yearly errors were summed, and then the sum was minimized by the Excel Solver. The result was that n = 1.00, the slope of the curve shown in Fig. 1. The actual numbers that fit the first equation were n = 1.00525, k = 0.481 with the summation of errors being 1.225. This large summation of errors is due to the cyclic nature of the energy cost index with respect to the investment cost index, which is also obvious in Fig. 1. The value for k of 0.481 is just a scaling factor between the two indexes and is not a helpful part of this analysis.
Investment and energy
After the 1984 elevation of energy over construction costs, the cost of industrial energy dropped below construction costs rapidly for more than a decade. So in 2008, potential investors must make a decision about the expected financial returns from new or expanded energy production and processing investments.
Potential investors realize that these financial returns are largely a function of energy policies, not technology or energy resources. So an optimal energy policy for international petroleum producers might be to randomize increasing petroleum prices. The implication of this external policy is that domestic energy policy should stabilize energy markets with loan guarantees for new economically attractive, long-term energy production and processing facilities, etc. In addition, environmental constraints, in particular carbon dioxide emissions, should be economically reasonable and stabilized.
Potential investors must also accept rather high investments required per unit of energy made available. The public example is drilling in ultradeep water, a production realm in which records of depth and distance from shore are being set frequently. Tar sands and heavy oil production also represent large investments per unit of hydrocarbon energy made available.
The world will never run out of oil, only the oil that can be produced economically relative to other energy sources. That concept was elaborated on in the previous article mentioned earlier, which estimated the amounts of oil ultimately to be produced based on historic production data. It was necessary to include a price of oil, fourfold greater than in 2002, relative to other energy sources to establish an amount of oil ultimately to be produced, Q∞.
A value of 2.3 × l012 bbl was chosen to fit historic world petroleum production data shown in Figs. 1 and 3 of that analysis.1 A recent example of costs and energy policy constraining energy availability is the FutureGen coal-fired electric power plant. Increasing estimated investment costs have resulted in investing companies and the Department of Energy backing off from that project.
“Free” renewable energy resources such as wind and solar are particularly sensitive to high investment costs per unit of energy actually produced, since both wind and solar are intermittent and then vary in intensity, even when nominally available. In addition, the economies of scale for solar and wind are less favorable than they are with traditional chemical processing plants and refineries. It takes a whole line of duplicate wind turbines to generate major amounts of electricity since the size of each unit is limited by materials and mechanical design factors as well as the nature of the wind. Solar collectors are sold by the square foot, so doubling the output power approaches doubling the cost of the proposed solar power facility.
Another factor is the increase in estimated investment costs as more-detailed designs are completed for new processes. In 1981 the author estimated, using 27 data points, that these increases in investment costs resulting from more-realistic designs were 18%/year for proposed 250 MMcfd Lurgi synthetic natural gas plants over the 9-year period in which SNG plants were being discussed.2 This is an 18%/year increase beyond the inflation of construction costs estimated with the Chemical Engineering Index.
Indexes commonly used to correct construction costs as a function of time are for existing and proven plant designs. These indexes include the Chemical Engineering Index, Nelson Refinery Index, and Marshall Swift Installed Equipment Index. This historic observation of increasing estimated investment costs as more detailed design are completed contrasts with the promises of less costly facilities in the future. Reduced costs for construction of future facilities, termed the learning curve, are demonstrated for technologies that are already commercial.
It is easy to project new processes that have very desirable features in today’s context. For example, high-pressure gasification of residual biomass with sequestration of carbon dioxide in deep saline aquifers would result in a process with a major negative carbon footprint: CO2 would actually be removed from the atmosphere. Now, add membrane separators to separate hydrogen from the gasifier product gases for use in fuel-cell powered vehicles. Transposing this two sentence conceptual process into reality would require many million of dollars and several years of effort. It then might be found that the actual costs were still prohibitive.
Many people and firms promoting their own renewable energy or environmental cleanup processes fail to appreciate the extensive costs associated with process development and then actual deployment.
The author would be pleased to supply the raw data and calculations to interested persons. There may be other ways to look at the data. Please request the Excel file by e-mail to the author at [email protected].
References
- Parker, H.W., “Demand, supply will determine when world oil output peaks,” Oil & Gas Journal, Feb. 25, 2002, pp. 40-48.
- Parker, H.W., “Cost Estimation of Synfuel Plants—Use of cost indexes,” ESCOE ECHO, Engineering Societies Commission on Energy, Washington, DC, Vol. 5, No. 5, Mar. 30, 1981, p. 2.
The author
Harry W. Parker is professor emeritus of chemical engineering, Texas Tech University. He has been involved in energy-related research at many levels, including in positions with Phillips Petroleum Co. and Washington, DC, research organizations. He was associate and full professor in the Texas Tech University Department of Chemical Engineering from 1970 until his retirement. He holds degrees from Texas Tech University and Northwestern University.

