BP is using a highly automated workflow to evaluate the PUT River formation, an early Cretaceous sandstone reservoir on Alaska’s North Slope.
This sandstone has four discrete lobes forming separate reservoirs, with different fluids and pressures. BP focused on the southern lobe, with an estimated original oil in place (OOIP) of 12.6-19.2 million stock tank bbl (MMstb). Part 1 of this article discussed the geology, rock properties evaluation, fluid properties, geostatistical modeling, and reservoir development options for the southern lobe (OGJ, July 14, 2008, p. 55).
A key step was flow simulation work to design a pattern flood for the PUT River reservoir. This concluding article describes top-down reservoir modeling (TDRM) that the team used to assess the effect of reservoir uncertainty on ultimate oil recovery.1 It describes the field implementation of the pattern flood along with field observations.
Uncertainty estimation
One of the main objectives of the PUT River study was to estimate the effect of uncertainty of various reservoir parameters on the success of PUT River development because any unexpected downside outcome could diminish its economic viability.
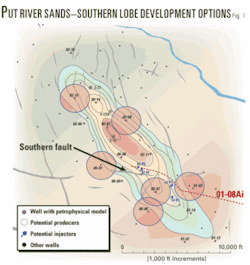
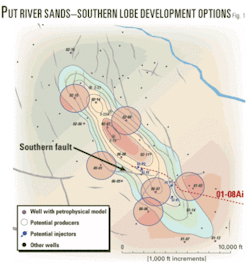
Fig. 1 is a guide for understanding the development options available. Many existing penetrations could become producing or injector wells by recompleting them in the PUT River sand. The quality of the reservoir rock decreases from northeast to southwest.
Overall development uncertainties are:
- Fault transmissibility. How transmissive is the fault near the southwest edge of the lobe? A sealing fault could make the injection less effective.
- Rock quality, connectivity between the injector and producers? The correlation length of permeability in both depositional and transverse directions is unknown.
- Number of producers needed to optimize ultimate recovery?
- Injector location and type? Choose either vertical or horizontal injectors to get adequate injection into the rock.
All combinations of the options had to be evaluated for us to choose the optimal development plan.
Well options
Options for producing the PUT River include:
- One production well (Well 2-23A).
- Two producers (2-23A and 2-27).
- Three producers (2-23A, 2-27, 2-19).
- Two producers (2-23A and 2-19).
- Four producers (2-23A, 2-27, 2-19, and 2-20).
Options to place the injector wells for the pattern flood include:
- One injection point, south of the fault (SI 1).
- One injection point, north of the fault (SI 2).
- Two injection points (SI and SI 2) with:
- Continuous injection.
- Toe injection, followed by heel injection only.
- One injection point, far north end of the lobe.
Fault transmissibility is one of the uncertainties, and was modeled at 0%, 25%, 50%, and 100%.
Rock quality
Geologic uncertainty hinges on the rock quality. We estimated the effect of rock quality uncertainty using these combinations of correlation length of the permeability field when generating the geostatistical models:
- 7,500 ft (NW-SE): 2,500 ft (NE-SW).
- 2,500 ft: 800 ft.
- 2,500 ft: 1,250 ft.
- 800 ft: 2,500 ft.
- 750 ft: 250 ft.
TDRM background
To evaluate the effect of various combinations of all the options, BP implemented a TDRM approach. TDRM is a philosophy for simplifying uncertainty analysis that can provide the simplest appropriate model for an optimal business decision.1 The workflow is highly automated and enables customized decision-making. BP’s assisted depletion planning process, top-down depletion planning (TDDP), was not used for this study.2
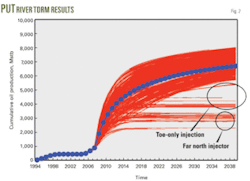
Using TDRM to evaluate the effect of the previously mentioned parameter uncertainties generated 960 simulation runs. Fig. 2, which compares the potential cumulative oil produced from all the simulation runs, summarizes the simulation results. The options that involve injection only at the toe of the southern injector and a single vertical northern injector are clearly sub-optimal, yielding low ultimate recovery because of quick water breakthrough and water cycling.
The base case run has these parameters:
- Fault transmissibility: 0.5.
- One production well: 2-23A.
- One injection well: SI 1 (south of fault).
- Variogram parameters: correlation length of 2,500 ft in the NW-SE direction, 800 ft in the NE-SW direction, and 4 ft vertically.
TDRM results
The TDRM gave insight into the relative impacts of rock heterogeneity, production well location, injection well location, and transmissibility across the southern fault.
We captured the effect of uncertainty in rock property or heterogeneity by varying the correlation length of the permeability field of the geostatistical model.
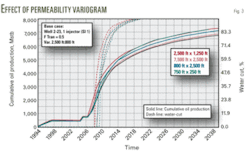
Fig. 3 summarizes the effect of rock heterogeneity; it presents the cumulative oil produced and water cut as a function of time. Ultimate oil recovery is insensitive to the correlation length of the permeability field.
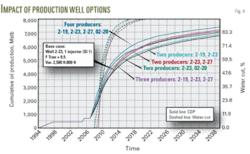
Fig. 4 summarizes estimated cumulative oil production with the various producer options. The base case with production well 2-23A provides about 5 MMstb. Adding well 2-27 and well 2-20 adds another 1 MMstb to the ultimate oil production. Well 2-19 has a marginal impact on oil recovery.
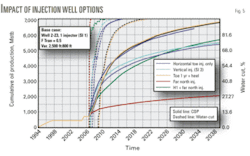
Fig. 5 summarizes the projected effect of various injection options on ultimate oil production. Any combination of injection at the far north side leads to early breakthrough and water cycling, thereby yielding a low ultimate oil recovery.
Based on the modeling, we expect maximum oil recovery with slow growth in the water cut with a single (heel region of a high angle injector or a vertical injector) injector on the south of the fault or a horizontal injector (with the heel to the south of the fault and toe crossing to the north side of it).
We recommend the horizontal injector option because this mitigates the risk of low oil recovery due to the uncertainty of location and throw of the existing fault. A horizontal injector can also provide a higher injection rate compared to a vertical injector.
Varying the potential fault transmissibility from 0-100% indicates that the southern fault has minimal influence on reservoir performance.
Refining individual cases
In addition to examining the effect of parameter uncertainty, TDRM can also be used to further refine the effect of individual parameters. This section examines the influence of injector and producer selection in further detail. The effects from reservoir heterogeneity and fault transmissibility are minimal.
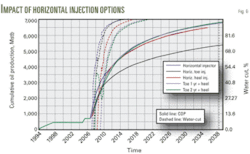
A horizontal injector that has the heel on the south side of the southern fault and toe to the north-west side of the fault is optimal for PUT River development. We studied five injection scenarios (Fig. 6). Injection into the toe (only) yields a poor ultimate recovery because of early breakthrough and water cycling.
All other cases yield more or less the same ultimate oil recovery. We chose the case that injects for about 1 year into the toe region followed by injection into the heel region as the optimal injection option for PUT River development. This option increases the reservoir pressure sufficiently above the bubble point pressure during the first year, assuring no release of solution gas in the reservoir, allowing optimal oil recovery.
Development cases
We simulated several development cases based on the TDRM analysis, and present three cases that yield high cumulative oil recovery. The horizontal injector near the fault is treated as combination of two segments: SI 1, the heel section to the south of the fault and SI 2, the toe region to the northwest of the fault (Fig. 1).
Case 1. Inject in injector SI 1 (south of the fault) only; produce from wells 02-23A and 2-20 until the water cut is 96%, then shut in 02-23A and 2-20 and produce from 2-27 and 6-07. We reviewed the simulation data by plotting the postulated oil production rate, water cut, and cumulative oil production as a function of time. We also plotted water saturation in the middle layer as a function of time, showing the expected areal sweep by water flood for 2007, 2013, and 2024.
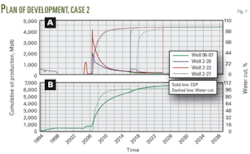
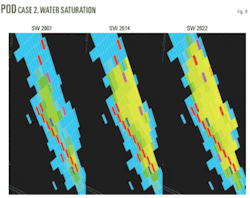
Case 2. Inject in the toe part (SI 2) of the horizontal injector for about 1 year, then inject in the heel region (SI 1). Produce from 02-23A and 2-20 until the water cut reaches 96%, then shut in 02-23A and 2-20 and produce from 2-27 and 6-07. Fig. 7 presents the results from the simulation run.
The dotted curves represent the water cut and the solid lines represent the oil rate for various producers in Fig. 7a; Fig. 7b shows the cumulative oil production. Fig. 8 presents water saturation in the middle layer as a function of time, which shows the progress of areal sweep.
Case 3. Inject into SI 1 only. Produce from 2-20 until the water cut is 96%, then shut in 2-20. Produce from 02-23A until the water cut is 96%, then shut in 02-23A and produce from 2-27 and 6-07.
Comparing the data, we found that Case 1 and Case 2 yield higher ultimate oil recovery than Case 3. As described earlier, however, Case 2 is preferred to Case 1 because the horizontal injector provides an option to mitigate oil recovery risks due to the uncertainty related to the location of the fault and its throw. It can also provide a higher injection rate compared to a vertical injector.
We also found that the sweep is better in Case 2, which provides accelerated oil production compared with Case 1. In Fig. 8, the brighter color represents higher water saturation.
As a result of this analysis, we chose Case 2 as the preferred development option for the southern lobe of the PUT River reservoir.
Implementation
Based on the TDRM results, BP initially developed the reservoir with one injection well and one production well, to be followed by a second producer. The injection well was completed in early 2006 and production commenced from a single well in October 2006. Initial production was 2,000 bo/d.
Injection and production rates are managed to maintain the reservoir pressure above the bubble-point pressure.
Designing an optimal development plan for a minor reservoir is a complicated process. This is especially true when the field has poor quality and heterogeneous reservoir rock, such as the PUT River sands of Alaska’s North Slope.
A number of existing well penetrations provided attractive options for recompletion but restrict the optimal placement of wells. Designing a successful flood process for a complex case like the PUT River can benefit from a TDRM process that can determine the effect of various reservoir parameter uncertainties.
This article shows this process through practical examples. Detailed numerical simulations led to the design of the optimal development case for the southern lobe of the PUT River sands:
- Optimal producer option. Produce from wells 2-23A and 2-20 with an option to produce from 06-07 and 2-27 in future.
- Optimal injector option. Horizontal injector or southern vertical injector. Using a horizontal injector mitigates geological and fault uncertainty.
- Inject in the middle 10-15 ft.
- Upside potential for off take in the far north and southwest.
Acknowledgments
We thank the owners of the Prudhoe Bay Unit for their permission to publish this work. The conclusions presented are those of the operator and may not reflect those of the other working interest owners.
References
- Williams, G.J.J., Mansfield, M., MacDonald, D.G., and Bush, M., “Top-Down Reservoir Modeling,” SPE 89974, 79th SPE Annual Technical Conference, Houston, Sept. 26-29, 2004.
- Litvak, Michael, et al., “Field Development Optimization Technology,” SPE 106426, 2007 SPE Reservoir Simulation Symposium, Houston, Feb. 26-28, 2007.
