Contrary to previously published reports, Chad’s take (share of profits) from oil development is average by world standard.
The oil-producing consortium in Chad operates under a progressive fiscal system in that the government share of profits increases as profitability increases. It is unclear, however, if the royalty would have protected the government if oil prices stayed at or below $15/bbl. With low oil prices, Chad may not have received a royalty in the early years of production. But with higher oil prices, Chad’s fiscal system appears to provide good returns for the government.
Chad today receives about 70% of the profits from the oil development. This certainly is much higher than previously published expectations.
The producing consortium has strong incentives to keep costs down. It keeps about $0.40 of every $1.00 saved. Costs have been a controversial issue for the oil development.
Our analysis assumes that the consortium recovered sunk costs. Some feel that the consortium should not have recovered all of the sunk costs, thereby increasing by $1.1 billion the profit split between the government and consortium. Another complaint has been that the consortium is deducting exploration costs in other areas from the Doba basin production. We do not know if this is the case because ring fence terms (what exploration costs can and cannot be deducted from production) are not publically available.
The biggest overall complaint with the deal is the lack of transparency. This has caused problems for the consortium and Chad. One explanation for confidentiality provisions being included in these contracts is that governments often offer better terms for early contracts to entice investment. They would prefer that those terms not be made public because it could hamper subsequent negotiations.
A unit of ExxonMobil Corp. is the operator of the consortium with a 40% interest. The other consortium members currently are Petronas, 35%, and Chevron Corp., 25%.
Project controversy
The Chad-Cameroon pipeline project is one of Africa’s largest infrastructure projects and probably was destined to be controversial. Developing oil in one of the world’s poorest countries during a time of war, civil war, and coups carries huge risks. But when the World Bank Group became involved, controversy was assured. The World Bank acknowledges the project is the most scrutinized project in the bank’s history.
Among the many controversies, some dire and some perceived, is the notion that Chad received a bad deal. The assumption is that Chad simply did not have the negotiating experience of the oil companies. And, that inexperience or incompetence resulted in a disproportionately large share of profits or revenues going to the oil company consortium.
This article addresses this controversy associated with the impression that Chad received a bad deal, when in fact it did not.
Project overview
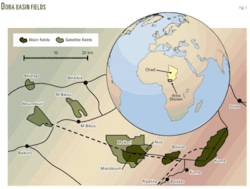
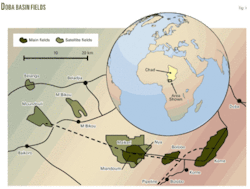
The first oil discovered in Southern Chad’s Doba basin (Fig. 1) was in the early 1970s, but civil war and other reasons delayed its development for several decades. In 1992, during a relative lull in the civil war, the oil company consortium approached the World Bank with development plans.
The plans anticipated producing nearly 1 billion bbl of oil and transporting the oil via pipeline across Cameroon to the Gulf of Guinea for export. The consortium approached the World Bank because it expected the bank’s involvement would mitigate political risk and ease the fears of institutional lenders. The World Bank saw an opportunity to design a standardized loan program that would serve as a model for aleviating poverty in Chad and other developing countries. Others saw a recipe for disaster.
Original development plans for the Doba basin’s three primary fields included about 290 producing wells and 25 injection wells with two-thirds of them for Kome, the largest field. The operations center and central treating facility also are at Kome.
The development cost estimate for the fields was about $1.5 billion.
Production started up when Miandoum came on stream in July, 2003. Kome and Bolobo production followed in 2004. Satellite fields Nya, Moundouli, and Maikeri went into production in 2005, 2006, and 2007, respectively.
In late 2007, the consortium submitted a development plan for Timbre field.
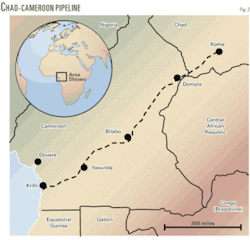
Completion of the Chad-Cameroon pipeline (Fig. 2) was in 2003 when Miandoum field was brought on stream. The onshore portion of the pipeline, buried at 1 m, is nearly 670 miles long. An additional 7 miles of submarine pipe terminate at a floating storage and offloading (FSO) vessel in the Gulf of Guinea near Kribi, Cameroon.
The 30-in. pipeline is designed to handle up to 225,000 b/d and has three pumping stations. Estimated pipeline cost was $2.2 billion or $109,000/in.-mile.
The fields reached a peak production at yearend 2004 of 212,000 bo/d. Production since then has declined rapidly at about 20%/year. New exploration activity and satellite field development, however, is expected to use the pipeline infrastructure for years to come.
Two companies operate the pipeline system: Tchad Oil Transportation Co. (TOTCO) in Chad, and Cameroon Oil Transportation Co. SA (COTCO) in Cameroon.
Cameroon owns slightly more than 5% of COTCO. Chad owns nearly 3% of COTCO, and more than 8% of TOTCO. The consortium member companies own the rest of the two pipeline operating companies.
Chad and Cameroon investments in the project as well as World Bank loans secured the government’s working interest shares.
Criticism of Chad take
One source criticizing the deal Chad received from the oil consortium is the book published by the Catholic Relief Services and Bank Information Center in February 2005.1 Although it thoroughly evaluates the project, it also provides a flawed comparison of Chad’s take to other African oil producers.
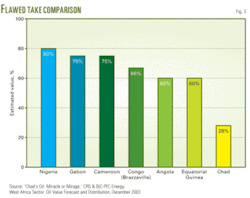
Fig. 3 is from this report and shows Chad’s take to be less than half the take of other West African countries. The message is compelling; however, the analysis is flawed.
The industry defines take as the division of profits from a project over its full life or full cycle, whereas Fig. 3 only focuses on 8 years, 2002-10. Chad’s oil did not start flowing until late 2003.
Most of the 8 years in Fig. 3 span the early production in the Doba basin, not full cycle. Early production years represent the capital cost recovery phase of a project. During this time it is common for the governments to receive only their royalty while oil companies recoup their investment.
With slow production and high costs, the investing companies could be in a non-tax-paying position for several years. Because the comparison in Fig. 3 does not cover the full life of the project, it does not represent a true division of profits or take for Chad but most likely does for the other countries shown.
Other statements from articles that imply Chad received a much worst deal include:
- “The World Bank’s own internal report estimates that most of the $9 billion revenue from the project over the next 28 years will accrue to the corporations and banks; the Chad government will receive only $1.7 billion (19%), with $505 million (6%) going to Cameroon.”2
- “Chad currently gets 12.5% of the royalties from its production of some 160,000 b/d, compared with the 80% of oil production that Nigeria enjoys.”3
- “Revenue split: 1. Cameroon = 7%, 2. Chad = 22%, 3. Oil Consortium = 71%,”4
- “Observe, for example, the difference in the mere 7% of revenues that accrued to Chad in its earliest contracts compared to the approximately 90% of revenues going to the more experienced and capable petrostates.”5
Four reasons why there is so much confusion, particularly with the range of values of Chad’s share of revenue or take from these sources include:
- Lack of transparency. A confidentiality provision in the contract has kept important contractual details out of reach of analysts.
- Industry terminology. The World Bank’s Project Appraisal Document (PAD) added to the confusion with the introduction of distributable returns, which appears to represent a distribution of profits but certainly does not.
- Chad royalty. The Chad royalty is not a percentage of gross revenue, but rather a percentage of gross revenue less transportation costs.
- Inexperience. There seems to be a general misunderstanding of how petroleum fiscal systems work.
The following analysis uses information from three sources–the World Bank’s Project Appraisal Document (PAD) Report N. 19343 published prior to construction, the World Bank’s Implementation Completion Report No. 36560-TD (ICR) dated Dec. 15, 2006, and EssoChad Quarterly Reports.
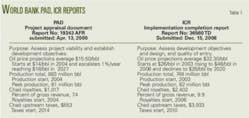
Table 1 summarizes data from the two World Bank reports.
Anticipated production
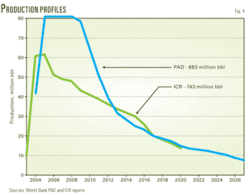
The PAD anticipated Chad producing (exporting) 883 million bbl between 2004 and 2027, with peak years of production at 81 million bbl or about 225,000 bo/d (Fig. 4). The ICR lowered production expectations to 748 million bbl and peak production of only 170,000 bo/d. These figures do not agree necessarily with other sources.
There were also natural expectations of increased investment, exploration, and satellite field development once the pipeline system was in place.
Crude quality
The oil from Kome, Miandoum, and Bolobo fields constitutes the Doba Blend, which has a heavy oil 18.8-20.5º API gravity.
The Doba Blend wellhead price has a discount from the price of Brent Blend, with a 38.8° API gravity, to accommodate the quality differential and distance to market.
The discount was expected to be about 20% off the Brent price in the World Bank’s ICR. With increasing worldwide demand for transportation fuels, which are difficult to extract from the Doba Blend, the discount could be greater than the anticipated 20%.
Distributable returns
As identified in the two studies, Table 2 shows the distributions to the governments of Chad and Cameroon and the consortium. It is likely that this part of the World Bank data provided the foundation for the varied reports that Chad received a bad deal.
Upon first glance, distributable returns appear to represent a distribution of profits (take) or revenues. Unfortunately, the analyses in the two World Bank studies provide little insight into the actual meaning or function of distributable returns. Ultimately, sunk costs, in addition to some percentages of capital and operating expenditures must still be recovered from distributable returns to obtain a true distribution of economic profits for the project.
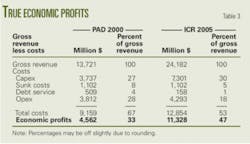
Table 3 shows the true economic profits (gross revenues less costs). Our analysis includes sunk costs of $1.102 billion mentioned in the PAD report but not used in its cash flow model.
A huge difference obviously exits between distributable returns and economic profits, but many published sources seem oblivious to this distinction.
Analysis focus
Our analysis focuses on five points:
- Overall division of profits or the government’s and consortium’s take.
- Effective royalty rate. What is the minimum revenue Chad can expect each accounting period once production starts?
- Savings index. What is the contractor’s incentive to keep costs down?
- Price and cost assumptions.
- Timing.
The analysis uses these industry standard definitions:
- Gross revenue, which is the total revenue generated over the full life of the project (full cycle).
- Costs, which include capital costs, operating costs (opex), transportation costs, and reclamation and refurbishment costs or abandonment costs.
- Economic profits, which is gross revenue less costs (full cycle).
- Government take, which is the government share of economic profits during the full life of the project full cycle).
- Effective royalty rate (ERR), which is the government share of revenue in any given accounting period (not full cycle). During the typical worst-case accounting periods, the costs are high and production is low. In a royalty-tax system, the royalty is the only guarantee the government will receive any revenue in those worst-case accounting periods for most systems.
- Savings index, which is the share of savings the contractor, or consortium, keeps if there is a reduction in costs. It represents their incentive to keep costs down.
Chad’s fiscal terms
Chad has a royalty-tax based fiscal system.
In 2000, Chad received a $25 million signature bonus when Chevron and Petronas joined the consortium. It received two additional $15 million signature bonuses related to exploration agreements in 2003 and 2004.
Bonuses are not unusual, and the bonuses Chad received were not particularly large, about $0.05/bbl based on the PAD reserves expectations.
The bonus has no substantial impact on the economics because oil companies typically do not recover bonuses but it is not unusual for bonuses to be tax deductible.
Chad’s royalty is 12.5% of gross revenue less transportation costs. The industry refers to this as netbacking. Although it can be controversial, it is not unusual. The controversies associated with netbacking stem from:
- Abuse of deductions that result in lower royalties to the royalty owner.
- Lack of information or transparency that makes it difficult for royalty owners to verify royalty determination.
We have no evidence of the consortium inflating deductions for royalty determination; however, the royalty determination method and definition do lack transparency.
Chad’s transportation costs have four parts: Cameroon transit fee, opex (pipeline), debt service, and throughput payments.
The Cameroon transit fee is a fixed $0.41/bbl paid by COTCO to Cameroon for passage of crude oil through its territory.
Opex includes both operation and maintenance costs associated with the pipeline.
The debt service is not defined in the report but assumed to be a mechanism for recovery of pipeline loans and interest charges.
The throughput payments are complex calculations for recovering pipeline investments. No additional information on this component is available.
It is quite possible that this method of royalty determination drove the design of the World Bank cash flow model, resulting in distributable returns that became a major source of confusion.
Chad taxes are based on an R factor or payout formula and range from 40% to 65%. The R factor equals cumulative receipts divided by cumulative expenditures.
Exactly how the Chad R factor works is unavailable; however if it behaves like most R factors, it would resemble the hypothetical sliding scale shown in the accompanying calculation box.
As the consortium recovers its investment, the R factor and tax rate increase. When cumulative receipts equal cumulative expenditures, the consortium will have reached payout and R will equal 1. The subsequent tax rate will equal 50% in the hypothetical sliding scale.
According to some sources, the current tax rate has already progressed to 60%. In other words, if these reports are true, Chad is receiving 60% of the profits through the tax mechanism in addition to royalties.
What is not clear, and adds to the confusion, is what costs are recoverable and or tax deductible and how they are handled. PAD recognizes sunk costs but does not use them in calculating distributable returns. In all likelihood, the consortium is recovering and tax deducting sunk costs, but that is not certain.
The World Bank PAD estimated project capital costs of $3.7 billion, and total operating costs of $3.8 billion. The ICR estimated costs are greater, but as a percentage of gross revenue, they are much lower. Table 4 shows the costs details from the two reports and presents them as a percentage of gross revenue.
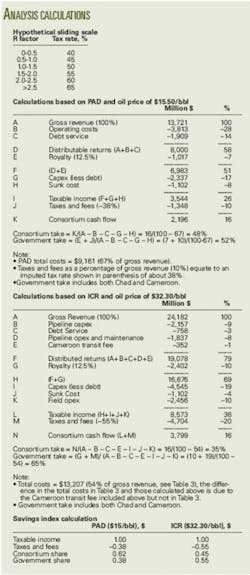
The calculation in the box follows the World Bank PAD cash flow model as far as distributable returns, after which we account for additional costs incurred in the project to obtain the division of profits or take.
In the PAD base case, with oil prices averaging $15.50/bbl, Chad and Cameroon government’s share of profits or take is 52%.
The World Bank’s ICR cash flow appears to follow the netbacking scheme more to closely, the calculated royalty after transportation costs has been deducted from gross revenue. Gross revenue less transportation costs equates to distributable returns out of which the royalty is taken.
The calculation in the box follows the ICR cash flow up to the royalty calculation then includes unrecovered costs to determine true division of profits.
Effective royalty rate
The notion of ERR is 11 years old now and should be considered a normal or essential part of the analysis (OGJ, Dec. 1, 1997, pp. 49-51).6 The ERR calculates what government revenue would be in a worst-case accounting period, such as early production when contractors could be in a nontax paying position, which is not uncommon.
With a royalty-tax based system, the royalty is typically the only guarantee a government will receive some revenue in any given accounting period. In the Chad agreement, the royalty is determined after transportation costs are recovered. But due to confidentiality provisions in the contract, it is impossible to evaluate how those costs are recovered, so that it is not possible to quantify the amount (if any) that the royalty guarantees Chad will receive some revenue in the early years of production.
From the cash flows of the World Bank’s documents, the PAD shows royalty payments starting in the first year of production, 2004, while the ICR does not show royalty payments to Chad until 2006, 3 years after the 2003 production start. We do know that Chad did receive royalties prior to 2006, most likely due to the higher oil prices.
It is likely the Chad royalty offered no guarantee that the government would receive revenue during early production.
Savings index
The savings index is a measure of the incentive a contractor and a government have to keep costs down. If $1.00 is saved, how is that $1.00 shared between the contractor and government? In the previous examples the tax rates when oil prices were $15.50 and $32,30 were about 40% and 50% respectively. A $1.00 saved increases taxable income by $1.00.
The savings index is a function of the tax rate as shown in the calculation box.
References
- Chad’s Oil: Miracle or Mirage? Following the Money in Africa’s Newest Petro-State, Catholic Relief Services and Bank Information Center, February 2005.
- Rowan, D., “Chad-Cameroon oil pipeline gets the go-ahead,” world socialist web site, Aug, 21, 2000, http://www.wsws.org.
- Soares, C., “Chad eyes bigger share of its oil profit,” Gas & Oil Connections, Sept. 27, 2006.
- Lathrop, L., presentation at the US Army Command & General Staff College, University of Kansas, Oct. 16, 2006.
- Karl, T.L., Escaping the Resource Curse, Chapter 10, “Ensuring Fairness: The Case for a Transparent Fiscal Social Contract,” Columbia University Press, 2007.
- Johnston, D., “Index useful for evaluating petroleum fiscal systems, OGJ, Dec. 1, 1997, pp. 49-51.
The authors
David Johnston is managing director of Daniel Johnston & Co. Inc. and has worked on numerous international projects. He also works with AHEAD Energy, a nongovernmental organization (NGO), on small-scale energy development projects in Africa. Johnston has a degree in electrial engineering from the University of Rochester.
Anthony Rogers is an engineer with Daniel Johnston & Co. Inc. He has worked on projects in the Middle East, Europe, North Africa, and Asia. Rogers has a degree in mechanical engineering from the University of Texas.
