A recent examination of cash margins showed how refinery profits have changed since 2002.
The results indicated a divergence between crude price trends (resulting in increasing profits to producers) and refinery profit trends. Refinery profits were in a decline after rising between 2002 and the middle of 2006 while crude oil prices continued to rise. Crude oil prices and petroleum product prices are currently at record levels.
This study used Muse, Stancil & Co. refinery margins as an indicator of refinery profit trends. Representative crude prices were used to indicate crude price trends.
If product markets and crude oil markets were both truly global, margins would remain constant with respect to crude prices; the only variations would be due to transportation costs. The product markets are not, however, as fluid worldwide as are crude markets.
Part of the issue is that product specifications differ in various parts of the world. Another factor is differing relationships between crude prices and petroleum product prices in different regions of the world. Petroleum product markets are heavily influenced by taxes and government policies.
Derived demand for crude was growing faster outside of the US during the period of this study. This situation resulted in the rise in crude oil prices that was faster than the rise in product prices within the US. Refining margins declined becuase product price increases reduced domestic demand growth.
Muse, Stancil margins
The Muse, Stancil refining margins were designed to compare relative refining profitability of six refining centers including the US Gulf Coast (USGC) and US West Coast (USWC). Muse, Stancil began publishing these indicators in 2001, which are currently published monthly in the Oil & Gas Journal.
Refining margins are cash operating margins. Fixed and variable operating cost estimates are subtracted from the gross margin to arrive at a cash operating margin for a typical refinery in each region.
The Muse, Stancil margins are on a per barrel basis. If there is a reduction or increase in total barrels sold, therefore, this indicator will not account for the volume effect on total profits. This becomes relevant because higher product prices induce a reduction in the growth rate of products consumed.
Muse, Stancil estimates feedstock and product slates along with operating costs for the typical refinery in each region. A problem with this measure is that fixed costs in the typical refinery may need to be revised more frequently. As the cost of energy increases, the cost of many other factors of production including those deemed to be fixed may increase.
Rising petroleum prices indirectly affect a refinery’s infrastructure costs, including labor costs. Actual cash margins of typical refineries may therefore actually decrease to a greater extent than indicated by the Muse, Stancil margins.
Also, the typical refinery may change over time. The typical refinery chosen to represent the refining center which includes PADD II may cease to be typical when refineries are configured to handle Canadian heavy and synthetic crudes.
Margins are not strictly comparable when one is interested in the differences in profitability of the region as a whole as compared with another region. A better indicator of regional margins is a weighted average of the refineries in each region. Examining the patterns over time, however, can indicate relative changes in refinery profitability within and between regions.
This study used USGC and USWC margins and crude wellhead prices to illustrate how profitability varied between regions and how rising crude prices influenced refinery profitability. These were chosen because refinery configurations since 2002 have not changed and to illustrate the difference in margins between regions which are “open” and a region which is isolated. This latter distinction is not treated in detail in this article.
Modifying ‘constant’ dollars
Cash margins and crude wellhead prices, beginning in January 2002 and ending in March 2008, were used in this analysis. To view the margins and crude oil prices over time in a meaningful way, they were adjusted for general price inflation using a GDP price deflator. For this study, all values were adjusted to first-quarter 2002 prices.
Crude price history
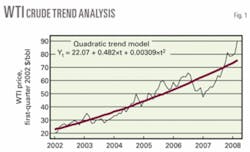
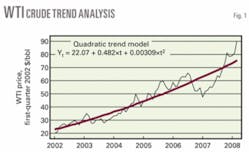
Fig. 1 shows a trend analysis of the price of West Texas Intermediate (WTI) crude. A quadratic trend line does a better job of capturing an increasing or decreasing rate of change. If the trend is really a linear trend, the quadratic term automatically would become insignificant, both in magnitude and statistical significance. Inclusion decreases the possible bias in the trend estimate as long as the actual trend conforms to a quadratic form.
Changes in this price as well as the trend should mirror the crude price paths of most crude supplies in the USGC region. The trend is clearly upward.
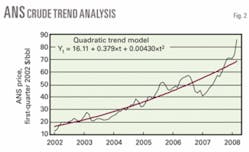
Fig. 2 shows the trend for Alaskan North Slope (ANS) crude prices, which represent crude costs in the USWC region.
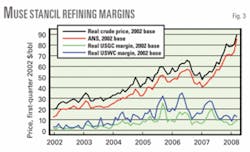
As a comparison, Fig. 3 shows the Muse refinery margins for the USGC and USWC regions plotted with crude prices. The WTI and ANS trend upward while the two margins are now trending downward.
Effect of rising oil prices
The analyses showed that, after a point, rising oil prices began to erode refining profits. This occurred because crude prices were rising faster than product prices. The problem was and is that, while the crude market is worldwide, product markets are more regional. If products moved around the world as easily as crude does, prices would track each other and margins would not be influenced directly by increasing crude prices except for time lags in response.
Demand for crude worldwide was and is growing faster than demand for products in the US. This is a problem for refining companies because the result of these trends is an eventual profit squeeze.
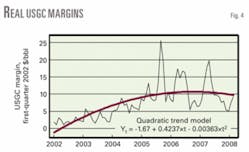
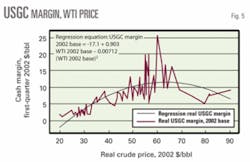
Fig. 4 shows USGC margin trends. The trend turned downward around October 2006. Fig. 5 shows a regression line linking USGC margin and WTI prices. The margin began to decline after $63.41/bbl based on the regression equation. First derivative of the regression equation set to zero yields the peak margin.
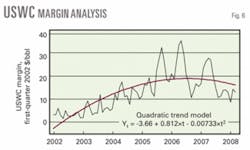
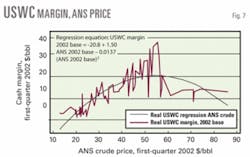
Figs. 6 and 7 show a similar analysis for USWC. Fig. 6 indicates how the cash margin began to decline in July 2006. Fig. 7 shows the correlation of the margin with ANS prices.
The USWC margin began to decline after the ANS price reached $54.74/bbl, based on the regression equation. Although the cash margin is not completely dependent on crude oil prices, it highly correlates with these prices.
USGC vs. USWC margins
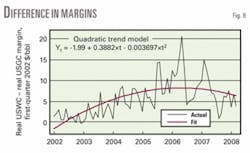
Fig. 8 shows how the difference between the USWC and USGC margin has changed since 2002. The spread between USWC and USGC cash margins began to decrease after April 2006, based on the trend line. Although the profitability of USWC refineries was greater than those on the USGC, this difference is eroding and will eventually disappear if the trend continues.
Two major forces that determine the price of any product are supply and demand. If one grows faster than the other or shrinks faster than the other, the price will change to adjust for the imbalance.
For gasoline, for instance, demand growth increased faster than the supply resulting in a rise in the price relative to production costs in the US. Production costs began to increase faster than product prices in the US, as the growth in world demand for crude oil exceeded the growth in demand for petroleum products in the US.
Demand for gasoline in the world continued to grow at a rate greater than that in the US as developing countries like China restricted petroleum product price increases to below market-clearing prices. The result was a higher derived demand for crude globally vs. the US. Production cost increases were therefore not wholly covered by product price increases as evidenced by the problems that companies in China have experienced during the last year.
In the US, refining companies may see profits turn to losses soon. Companies with crude production of significance may be able to cover refining losses with crude profits. World economic growth and US policies cause product prices to rise while refining profitability is declining.
Politicians who want to impose taxes on the oil industry because profits have been high, miss the point of supply-demand forces and how these are integrated into the world economy. Cycles in refinery profits occur and when profits are high, politicians seem to ignore the times when profits are actually negative or, at best result, yielding rates of return on investment below reasonable levels.
Two factors that contribute to the problem’s severity, given the growth in world demand for petroleum, are restrictions placed on exploration and development of domestic crude oil supplies, including shale, and barriers to building new refinery capacity. Refineries expand, but the configurations are not optimal.
There is functional obsolescence because refineries that are expanded cannot be made to be as efficient as a new refinery could be. This generally results in higher production costs and lower production levels than if new refineries were built.
The author
Robert Neumuller ([email protected]) is an independent consultant, Plano, Tex. He has 30 years’ experience in the refining and energy industries and has also served as a consultant for Muse Stancil & Co., Arthur Consulting Group Inc., and CPN Consultants Inc. He previously held positions with Southern California Gas Co. and Phillips Petroleum Co. Neumuller holds a BS in chemical engineering from the University of Maryland, an MA in economics from Ohio State University, and an MBA from the University of Southern California. He is a member of the American Society of Appraisers and the National Association for Business Economics.
