The oil and gas industry in the Gulf of Mexico has the greatest weather exposure in the world and is vulnerable to a range of losses that include physical damage and destruction, business interruption, and pollution liability.
A number of offshore facilities, drilling rigs, and pipelines were destroyed and extensively damaged in the 2004 and 2005 hurricane seasons. The destruction from hurricanes Ivan, Katrina, and Rita was severe with 122 structures destroyed and 76 others severely damaged. The physical impact of the hurricanes to the offshore infrastructure has been widely reported in the trade press, but the financial impacts of decommissioning and the potential value of the lost production have not been examined.
The purpose of this four-part series is to examine the destroyed infrastructure from the 2004 and 2005 hurricane seasons and the likely contribution this collection of assets would have made to future production in the gulf.
In Part 1, we describe the weather risk that operators encounter and review the factors that are involved in redevelopment decisions. The impact of the 2004 and 2005 hurricane seasons on the infrastructure and production statistics in the gulf are summarized.
Weather risk
Storms and hurricanes regularly challenge and endanger the coastal community and energy infrastructure in the Gulf of Mexico.
Powered by heat from the sea, a hurricane acts as a gigantic heat engine transforming warm ocean water into powerful wind fields. The wind fields generate waves and current that interact with the built environment, increasing the stress load on offshore structures, which in some cases, leads to catastrophic failure and destruction.
Tropical cyclones are steered by the easterly trade winds and the temperate westerlies, and around their core, winds grow with great velocity and generate ferocious and violent seas. Each year around 100 tropical disturbances develop between May and November over the Atlantic Ocean. About 25 of these disturbances develop into tropical depressions, of which on average 10 become tropical storms, 5 become hurricanes, and 2-3 are likely to strike the US coast.
Storms that grow into 74 mph sustained winds are classified as hurricanes. Tropical storms traverse all parts of the gulf, and nowhere is immune from a hit. The official hurricane season in the Atlantic basin begins June 1 and ends Nov. 30.
Weather is a significant risk in the gulf because storms and hurricanes can damage and destroy facilities, drilling rigs, and associated infrastructure; interrupt production; and delay exploration and development programs. For day-to-day operations, offshore platforms are extremely safe and historically have performed at an acceptable rate of failure.
With the appearance of a tropical storm or hurricane, however, the risks of damage and destruction increase dramatically and unpredictably because structures must sustain wind speeds, wave forces, and potential mudslides that in extreme circumstances may equal or exceed their design capacity. In addition to the physical damage that may occur, other types of losses such as control of well, removal of wreck, business interruption, and loss of production income may also be incurred.1
Cleanup operations
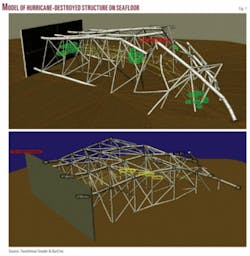
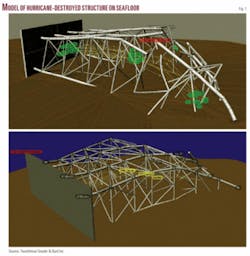
Structures destroyed in a hurricane are found lying horizontally on the ocean floor, often in a tangled web of steel (Fig. 1).
Structures typically do not fall cleanly; they fall as a mass. Pipes that cased the wells will bend and may collapse. Wells that are sheared off at the mud line will automatically shut-in as the platforms topple over.
Fortunately, all gulf wells are equipped with subsea safety valves to prevent fluids flowing out the wellbore in the event of damaged and-or destroyed topsides equipment, or in the worst case, loss of the supporting structure. Debris over and around the wells must be cleared and vertical sections of pipe accessed before the wells can be plugged and abandoned.
In extreme cases, an operator may have to drill a new well to access the old well. This often requires a dredging operation and excavating mud from around the wellbores. If the well is under pressure, it will be necessary to snub in to gain access; if the well is “dead” the reentry process is only marginally simplified.
Seafloor debris is cut and moved by divers or remotely operated vehicles (ROVs). Divers do the work with limited access and poor visibility, and the tasks are often complex and require the design of new tools. ROVs can reduce the need for divers, but in most cases, they are unable to perform all the operations required and are expensive to operate.
A section of the platform may need to be cut to gain access to the wellheads. Complete removal may not be technically feasible or may pose unacceptable risks to diver personnel. If the integrity of the platform is sufficient, the platform can be lifted and transported to shore or a reef site; otherwise, the toppled structure will be cut and removed in pieces, or dismantled at site in a manner that satisfies site clearance requirements.2
The risk and cost involved in decommissioning downed structures are significantly higher than under normal conditions, often ranging to 5-25 times more than conventional abandonment.
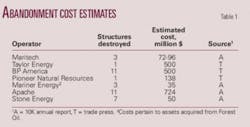
In some cases, cleanup cost is significantly more expensive. Taylor’s eight-pile fixed platform at Mississippi Canyon 20, for example, was destroyed by a mud flow incident during Hurricane Ivan. The structure collapsed and was moved 800 ft from its original location and submerged nearly 75% below the mud line. Estimates for cleanup have ranged up to $500 million.3
Abandonment cost estimates for hurricane destroyed infrastructure have not been made public because of concerns of litigation and ongoing insurance claims, but we have assembled a few cost estimates reported in the trade press and annual reports to give a sense of the magnitudes involved (Table 1).
The timetable for decommissioning depends on whether the lease is on production. If the structure is on a producing lease, owners have greater flexibility in scheduling cleanup and decommissioning activities, which will usually translate to cost savings. If the structure is not on a producing lease, the owner has one year after lease production ceases to return the seafloor to its condition prior to hydrocarbon development.
Redevelopment decisions
The decision to repair, replace, or abandon damaged and destroyed infrastructure is often difficult because of the uncertainty involved in cost estimation.
The return on investment that an owner would expect to receive depends upon the cost to fabricate and install a new platform, subsea assembly and-or pipeline interconnection-tieback, and the cost to reenter or drill new wells. Under normal circumstances, this decision is no different than an initial development decision, but in the case of destroyed or severely damaged assets, there are additional complications and uncertainties regarding the procedures and costs.
If the expected value of the remaining reserves exceeds the expected cost of redevelopment, the owner may decide that the property is worth the investment. There is little or no exploration risk, and it is possible that a field can be brought on-line at a higher rate of production to help offset the capital expenditures.
Assets capable of producing at high rates or those associated with significant levels of remaining reserves are more likely to be redeveloped than structures with low production rates and-or less reserves. Structures in close proximity to other infrastructure where production may be aggregated or drilling opportunities exist are also more likely to be redeveloped.
For mature fields, the natural energy of the reservoir is often near exhaustion, with production rates that are low and remaining reserves not likely to support the expenditures and payback required by investors.
Several factors work against redeveloping marginal reserves:
- Large commitment of resources and time required for cleanup prior to redevelopment activities.
- Marginal production rates and reserves, and limited upside opportunities.
- Risky production, since wells, even if reusable and in good condition, are old and few in number and may have mechanical problems.
Impact assessment
Aggregate losses
Losses incurred in a hurricane are a combination of physical damage and time element losses.
When production operations are disrupted, either by damage on site or elsewhere, cash flow is impacted. Insurance claims on time element coverage are typically categorized as business interruption from damage to assets (e.g., platforms, pipelines, etc.), and contingent business interruption, associated with damage to upstream facilities such as processing plants, trunk lines and refineries, owned by third-parties, which prevent production from being received.
Hurricane Ivan caused energy losses of $2.5-3 billion, while Katrina and Rita were responsible for a record $15 billion in losses.4 In Ivan, about two thirds of the total losses were attributed to business interruption and contingent business interruption, while for Katrina and Rita, physical damage was the major cause of losses. Two thirds of the energy-related losses due to Katrina and Rita have been attributed to physical damage.4
Shut-in production profiles
Shut-in production statistics are reported on a daily basis by operators when hurricanes enter the gulf and in the weeks and months after the event.
In a typical hurricane, 50-100% of the oil and gas being produced at the time will be shut in 1, 2, or 3 days depending on the strength and location (path) of the storm. Obviously, the more central the storm path is relative to production fields, the greater the amount of oil and gas will be shut in. Shut-in production is usually not “lost,” since after the storms pass and operators assess the integrity of their wells, pipelines, and structures, chokes and valves will be reopened and production resumed.
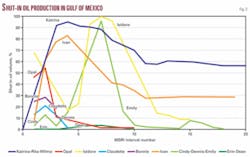
After Hurricane Ivan, damage to subsea pipelines, production platforms, and onshore processing facilities required six weeks to restore 80% of shut-in oil production and 10 weeks to restore 90% of shut-in gas production. The paths of hurricanes Katrina and Rita crossed higher-density infrastructure regions and caused more damage to the natural gas systems and processing facilities.5
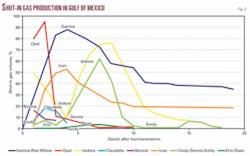
We plot the shut-in production profiles for oil and gas for major storms over the past two decades (Figs. 2 and 3). Many factors impact the shape of these curves.
The US Minerals Management Service (MMS) requires operators to shut down facilities and evacuate personnel with the approach of extreme weather, and thus the storm path, speed, strength, and operator response impact the rate at which production is shut in and the peak value of the curves. The duration of the storm and its impact on production facilities and pipeline infrastructure will determine the plateau and slope of the shut-in curve after peak.
Many factors may complicate and delay efforts to get production back to prestorm levels, including damage to onshore support facilities and staging areas, the availability of service vessels and helicopters, and the effects of personnel dislocation and property loss.
If onshore gas processing plants are inoperable for any length of time, for example, the loss could delay a recovery of natural gas productioneven if platforms and pipelines are unaffectedbecause gas needs to be processed before flowing to market. Production levels will return to prestorm levels if no wells, structures, or pipelines are damaged or destroyed. Production associated with destroyed wells and structures that are not redeveloped is classified as lost.
Damage rates
The amount of damage incurred from a hurricane would be expected to be roughly correlated with the strength of the storm and the number of structures in the storm path.
We tabulate exposure levels and physical damage estimates (Table 2). Damage rates are a probabilistic function, and we observe that the number of structures destroyed correlates weakly with damage estimates; e.g., the number of structures destroyed by Katrina was about half that of Rita, but Katrina’s losses were nearly double.
The number of offshore structures that are destroyed or damaged depends not only on the path and strength of the storm but also the physical characteristics of the wind and wave fields and their interaction with the offshore facilities, the location of the structure relative to the storm path, design characteristics, and various other factors.
The complexity of analysis requires sophisticated meteorological, met-ocean, and structural modeling to normalize exposed entities to wind speed, structure type, and design specifications.6 7
Destroyed structures
Hurricane Ivan entered the waters of the Mississippi River delta, the area most susceptible to underwater mudslides, and destroyed seven platforms and caused significant damage to 24 other platforms.
Significant damage is defined as damage that prohibits production or requires complete structural analysis of the platform before returning to production. Thirteen pipelines were damaged. Several drilling rigs were caught in the storm’s path and incurred extensive damage (Table 3).
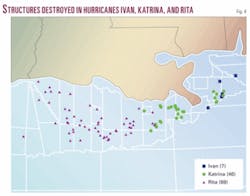
Hurricane Katrina entered the gulf in late September 2005 as a Category 4 hurricane and destroyed 46 platforms and severely damaged 20 others. Hurricane Rita followed in mid-October 2005 destroying 69 platforms and damaging 32 others (Fig. 4). A number of semisubmersible and jack up drilling rigs broke free from their moorings during the storms and drifted throughout the gulf causing additional damage.
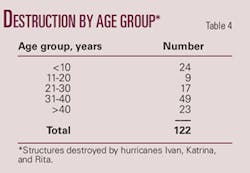
Most of the structures destroyed were older than 10 years, but some were in the prime of their production life cycle (Table 4). The majority of the destroyed infrastructurewith the exception of Typhoon and a small number of other developmentswere mature assets in the latter part of their life cycle.
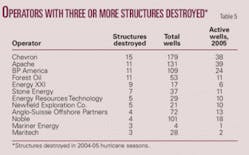
Chevron, Apache, BP America, Forest Oil, and Energy XXI owned more than half of the destroyed structures and a majority of the destroyed wells (Table 5). In total, over 850 wells throughout the gulf were destroyed by the storms.
Aggregate production
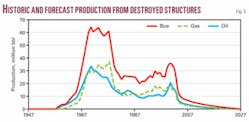
Gas, oil, and water production from the collection of hurricane destroyed structures as a percentage of total gulf production is shown in Table 6 and depicted graphically in Fig. 5 along with a forecast of future production.
null
Hurricane destroyed structures represented 1.2% of the total gas and 1.5% of the total oil production in the gulf in 2005 and 3.4% of the total produced water.
Structure classification
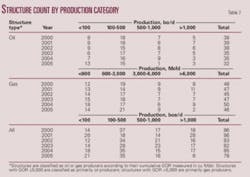
Structures are classified as primarily “oil” or “gas” producers using the cumulative gas-oil ratio (GOR), measured in cubic feet gas production per barrel oil production (Table 7).
For GOR <5,000, a structure is considered primarily an “oil” producer, while for GOR >5,000, a structure is considered primarily a “gas” producer. The amount of oil, gas, and BOE production is used to proxy the cash flow position of operators and provides an indirect indicator of the status of operations at the time of the event.
A marginal producer would likely be producing less than 50 b/d of oil or 300 Mcfd of gas, depending on structure type, water cut, oil and gas price, operating expense, and other factors, but it may vary at somewhat higher or lower levels. Production greater than 200 b/d oil or 1,200 Mcfd gas will be commercial under almost all circumstances.
As hydrocarbon prices increase, the threshold level of production which would be considered marginal decreases. Twenty-two structures, most of which were early in their life cycle, exhibit strong production levels and are the best candidates for redevelopment.
Next: Framework of a model to estimate lost production and revenue streams.
References
- Sharp, D.W., “Offshore Oil & Gas Insurance,” Witherby & Co. Ltd., London, UK, 2000.
- Kaiser, M.J., and Kasprzak, R., “The impact of the 2005 hurricane season on the Louisiana artificial reef program,” OGJ, June 11, 2007, pp. 43-52.
- Taylor, G., “MMS awaits Taylor Energy gulf platform salvage plan,” Oil Monthly, Jan. 5, 2007.
- Willis Energy Market Review, May 2006 (www.willis.com).
- “Impact of the 2005 hurricanes on the natural gas industry in the Gulf of Mexico region,” US Department of Energy, Washington, DC, 2006.
- Kaiser, M.J., Pulsipher, A.G., Singhal, A., Foster, T., and Vojjala, R., “Catastrophic event modeling1, How coverage has evolved for offshore storm risks,” OGJ, Dec. 3, 2007, pp. 39-47.
- Kaiser, M.J., Pulsipher, A.G., Singhal, A., Foster, T., and Vojjala, R., “Catastrophic event modeling2, Industry exposure and value at risk,” OGJ, Dec. 10, 2007, pp. 39-47.
The authors
Mark J. Kaiser ([email protected]) is professor and director, research and development, at the Center for Energy Studies at Louisiana State University. His primary research interests are related to policy issues, modeling, and econometric studies in the energy industry. Before joining LSU in 2001, he held appointments at Auburn University, American University of Armenia, and Wichita State University. He has a PhD in industrial engineering and operations research from Purdue University.
David E. Dismukes is associate director of and a professor at the LSU Center for Energy Studies. His research interests are related to the analysis of economic, statistical, and public policy issues in energy and regulated industries. For the past 20 years, he has worked in consulting, academia, and government service. He has an MS and PhD in economics from Florida State University.
Yunke Yu is research associate at the LSU Center for Energy Studies since 2007. His research interests are related to modeling and economic evaluation. He earned a bachelor of engineering degree in oil and gas transportation and storage from China University of Petroleum and a master of finance degree from Tulane University.
