Voxel volumetric visualization aids oil sands production optimization
This article outlines a volumetric visual method (voxel volumetric method) to visualize and model underground geological structures for optimizing in situ steam assisted gravity drainage (SAGD) well placement.
This voxel volumetric method uses logged well data from 257 shallow wells drilled in a 10 sq km area of a multibillion dollar tar sands project. Well log data are input into a voxel imagery method that creates an accurate visualization of complex underground structures relevant to optimizing bitumen sands production.
The difficulty is the complex geology of the tar sands deposits. Lack of understanding of the stratigraphy and sedimentology of the reservoir sands can hinder exploitation from regional exploration aspects as well as site-specific production and development.1
Brief SAGD review
In the SAGD process, steam injected into an upper injection well heats the surrounding bitumen-saturated sand and mobilizes bitumen oil. The mobilized bitumen, under the force of gravity, migrates to production wells.
Geological structures underground can form permeability barriers that hinder the above SAGD process. Such structures can cause oil production rates to decline, steam/oil ratios to increase, and reserves to be left behind as a result.
Optimal SAGD design is achieved when volume of steam coverage is unimpeded by impermeable layers of shale or clay (otherwise known as lateral accretions) associated with meandering fluvial systems. Careful well placement also minimizes steam requirements.2
Due to sound wave physics limiting the nature of seismic methods, geologists and geophysicists are finding that it is a difficult and complex task to fully integrate finer details of geological structures in tar sands deposits, such as sand-dominated bedding packages, precise vertical continuity of individual channel deposits, and the erosional contacts between similar lithologies. Seismic methods are limited to mapping large-scale features, such as the lateral extent of major meandering channels.3
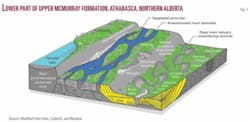
Well data were used from a project that consists of a surface mine development and partly of SAGD development in the Lower McMurray formation. In the Lower McMurray formation (defined by the Alberta Geological Society as the lower part of Upper McMurray formation), significant sedimentation for hydrocarbon accumulation occurs in low-stand fluvial-estuarine incised valleys, where a meandering river system deposited reservoir-quality point bar sands, said point bars contain several distinct facies, each with different reservoir properties (Fig. 1). The McMurray sands range from 20 m to 58 m thick, maintain high porosities from 30% to 35%, and are extremely permeable with permeabilities commonly ranging from 3 to 10 darcies.2
The facies of particular concern with respect to excellent bitumen extraction potential consists of medium to large-scale trough crossbedded, fine to medium-grained sand with rare mud drapes and laminae. The voxel visualization in this article is based on this particular formation of concern, as logged by client company geologists.
Voxel imagery
Voxel is short for voxel volume pixel, the smallest distinguishable box-shaped part of a three-dimensional image.
Voxelization is the process of adding depth to an image using a set of cross-sectional images known as a volumetric dataset. These cross-sectional images or slices are made up of pixels. The space between any two pixels in one slice is referred to as interpixel distance, which represents a real-world distance. And, the distance between any two slices is referred to as interslice distance, which represents a real-world depth.
The dataset is processed when slices are stacked in computer memory based on interpixel and interslice distances to accurately reflect the real-world sampled volume. Next, additional slices are created and inserted between the dataset’s actual slices so that the entire volume is represented as one solid block of data.
Now that the dataset exists as a solid block of data, the pixels in each slice have taken on volume and are now voxels. For a true 3D image, voxels must undergo opacity transformation along with tricubic interpolation. The tricubic interpolation ties structural elements tagged between wells together to form a picture of an underground structure.
Opacity transformation gives voxels different opacity values. This is important: It is crucial to expose interior details of an image that would otherwise be hidden by darker, more opaque outside-layer voxels.
Voxel images are primarily used in the field of medicine and are applied to X-rays, computed axial tomography (CAT) Scans, and magnetic resonance imaging (MRI) so surgeon professionals can obtain accurate 3D models of the human body.
We developed voxel imagery software and techniques that took core descriptions tagged by geologists as “excellent bitumen intervals.” Excellent bitumen intervals were considered by geologists as any bitumen core that had greater than or equal to 13% weight to weight bitumen content.
These excellent bitumen intervals were converted into three dimensional spatial references that served as useful input in the voxel volumetric method developed by our firm.
Company project geologists had logged several thousand meters of core data. Using a cutoff criterion of 13% bitumen content weight to weight, company geologists had tagged the well latitude, longitude, and depth of each of these high-percentage bitumen content cores.
Longitude, latitude, and depth is equivalent to the X, Y, and Z axis on our figures. The Z axis, or the dimension that represents depth underground, has been exaggerated nine times in our voxel figures in order to better show geological structures.
Bitumen content greater than or equal to 13% weight to weight bitumen content, considered at the time of the project 4 years ago as an economically significant cutoff value, was logged visually by project geologists, followed by a laboratory program that provided quantitative numerical weight to weight figures that had excellent correlation with geological observations.
Our technique only used as input logged core data meeting the 13% economic cutoff criterion or above this criterion. In other words, only structures of economic resource interest are mapped by this 3D method in three dimensions, and only data logged from project geologists were used, filtered by a greater than or equal to company-specific 13% bitumen weight to weight content.
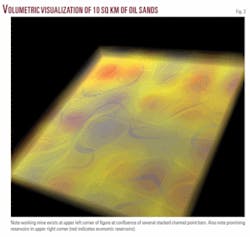
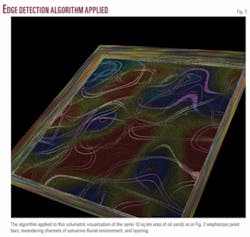
This resulted in the following comprehensive visualization of 10 sq km of tar sands north of Fort McMurray (Figs. 2 and 3). These figures show a complex estuarine environment composed of interfingered channel deposits.
Fig. 4 represents a blowup of Fig. 3. One can observe the confluence of several point bar structures in the blowup figure which represents a future potential mine. Estuarine channels, which represent low bitumen potential and bounding structures for point bars, can be readily observed in the figure as sinuous structures.
It is easy to observe sediment mounding and one incised valley in profile along the upper edge of the voxel image. In the horizontal X and Y plane of the figure, subtle textural and color changes represent inner to outer point bar structural detail. Cross-cutting relationships between meandering channels illustrate for geologists the time sequence of channel development in this estuarine underground environment. These cross-cutting relationships can be readily observed in Figs. 3 and 4.
This voxel visualization technology was developed in response to the inadequacy of seismic-based techniques to clearly define point bar structures in underground estuarine environments. Accurate visualizations of underground structure can provide production and geological planning teams with the necessary means to develop an optimal production plan for SAGD technology/surface mine developments.
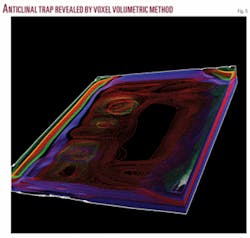
The same technology is also applicable to visualization of underground structures in traditional oil and gas plays as demonstrated by an image of an anticline trap based on well data (Fig. 5).
Summary
The described voxel volumetric techniques and software provide the means to accurately visualize an estuarine-fluvial environment, and in particular point bar structures associated with excellent bitumen extraction potential.
References
- McPhee, D., and Ranger, M.J., “The geological challenge for development of heavy crude and oil sands of western Canada,” UNITAR/UNDP 14th International Conference on Heavy Crude and Tar Sands Proceedings, 1998, pp. 1,765-77.
- Contreras, C., Drinkwater, N., Geel Cees, R., Hodgetts, D., Hu, G., Johannessen, E., Johannessen, M., Mizobe, A., Montaggioni, P., Pestman, P., Ray, S., and Saltmarsh, A., “Investigating clastic reservoir sedimentology,” Spring 2003, p. 60.
- Fustic, M., Skulski, L., Hanson, W., Vanhooren, D., Bessette, P., Hinks, D., Bellman, L., and Leckie, D., “Geological mapping and reservoir characterization of oil sands reservoir by integrating 3D seismic, dipmeter, core descriptions, and analogs in the McMurray formation, northeastern Alberta,” Search and Discovery, February 2008, p. 3.
Bibliography
Hein, F., Cotterill, D., and Berhane, H., “An atlas of lithofacies of the McMurray formation, Athabasca oil sands deposit, northeastern Alberta: surface and subsurface,” Alberta Geological Survey, Earth Sciences Report 2000-7, June 2000, p. 144.
The author
James Cormier-Chisholm ([email protected]) is founder of Subterranetech Inc. and is a data mining consultant and international finance writer. He also owns Chisholm Strategic Consulting, a firm specializing in financial predictive data mining on FOREX, commodity, and bond markets. He has a BS in geology from Acadia University, a diploma of engineering technology from University College of Cape Breton, and an MBA from St. Mary’s University.


