Recently there has been much in the press and in Congress regarding the deleterious effects of excessive energy futures trading.1 In relation to these claims speculators are blamed for increasing energy prices and price volatility. This is not the first time such arguments have been presented. However, these claims appear to be based on an unfortunate view of the size of energy futures trading activity relative to physical commodity usage, among other misunderstandings.
It is reputed that the daily trading volumes for natural gas futures exceed daily physical usage by 12-30 times:
“Volumes traded each day are estimated to be over 12 times the actual physical volumes consumed,” said Paul N. Cicio in a letter to US Sens. Saxby Chambliss (R-Ga.) and Tom Harkin (D-Ia.), regarding Commodity Futures Trading Commission (CFTC) reauthorization legislation, on Apr. 5, 2006. The statement refers to the natural gas futures and physical markets.2
Average daily trading volume in 1997 was more than 47,000 contracts, the equivalent of almost 20 times US gas consumption, according to the New York Mercantile Exchange (NYMEX) in 2001.3
And Mark N. Cooper, research director, Consumer Federation of America, said, “Natural gas may be traded over 30 times before it is consumed (i.e., the volume of trading exceeds the volume consumed by 30 times), fueling the suspicion that this trading drives up transactions costs and increases volatility.” Cooper’s report has been critiqued elsewhere (FERC, 2006, pp. 33-59), but not on the issue of this multiple.4
Similar claims are made regarding crude oil futures trading. NYMEX in 2006 said: “The futures contract is the most liquid trading instrument for crude oil, with daily trading volume averaging the equivalent of 230 million bbl of crude, approximately three times physical daily output.” The multiple of three times appears to refer to total global crude oil production, not just that for the US.5
These large multiples are presented by participants from both sides of the energy market manipulation debate. On the one hand, it is argued that the multiples indicate a high degree of liquidity that helps lower the costs faced by participants in the physical markets, who are interested in both risk mitigation and price discovery services.
On the other hand, it is argued that these multiples have the appearance, or are given the appearance, of hedge ratios, and hedge ratios of these magnitudes are quite unlikely to be optimal. Optimal hedge ratios rarely exceed a value of one, so a multiple of, say, 12, assessed in terms of hedge ratios, would likely suggest excessive, nonoptimal trading. These multiples are not hedge ratios and should not be interpreted as such.
The multiples are argued to be indicative of the excessive amount of energy trading activity carried out in the energy markets by noncommercial parties (often referred to as speculators or, more recently, as a lump called hedge funds), which subject the markets to manipulation. Each of these positions is wrong.
The cited large trading multiples are devoid of meaning and are the result of miscalculation. The multiples amount to comparing the average daily consumption to quantities to be delivered over the next 3,100 plus days. Comparing 1 day to 3,100 days clearly violates the “apples-to-apples” analyses that would carry economic and common sense meaning.
However, since these claimed multiples in the energy markets are repeatedly introduced into the policy debate regarding the role of speculators, and the potential for increased prices and price volatility, the basis for the calculations should be analyzed and corrected where wrong.
If observations regarding the relation between futures trading and physical usage are to provide meaningful input into new policy development, they must be based on correct analysis. And a correct analysis of these relationships shows that futures trading volumes actually account for only a fraction of physical usage.
The numbers
The multiples are typically calculated by converting the total volume of contracts traded for the commodity of interest on a given day (or an average or maximum for some time period) into the units used to discuss consumption of the underlying commodity. For example, gas is discussed in terms of daily consumption in billions of cubic feet. A single gas futures contract on the NYMEX represents 10,000 million btu. At 1,000 btu/cu ft, a single contract accounts for 10 MMcf of gas, or 0.01 bcf.
Oil is discussed in terms of barrels per day, with daily usage in millions of barrels per day, and each NYMEX oil contract represents 1,000 bbl.
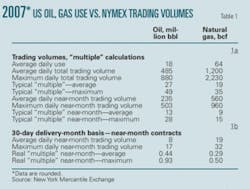
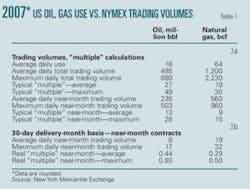
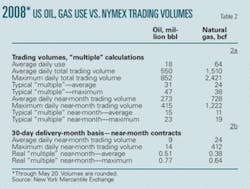
A summary of US average daily oil and gas usage in 2007 is reported in section 1a of Table 1 along with a summary of the daily trading volumes for futures contracts on the NYMEX for oil and gas. Section 1a of Table 2 reports similar information for 2008 through May 20.
The average oil consumption is typically stated as about 18 million b/d. The “correct” number to use for the average daily crude oil consumption is not a simple issue. The refinery feed in the US is about15-16 million b/d, but the futures contracts on the NYMEX are employed to hedge positions beyond just the US. Global crude oil use currently is about 87 million b/d, but not all of that will attract hedging interest through the NYMEX contract.
The units specified by each contract imply that the highest trading volume for oil in any single day during 2007, for all contracts open, amounted to 880 million bbl. When this total trading volume number is used, it includes contracts covering maturities through December 2016roughly 3,130 days into the future.
Average gas consumption amounts to about 64 bcfd. For gas, the highest daily futures trading volume represents 2,230 bcf. The average trading amounted to 485 million b/d of oil and 1,200 bcfd of gas. These daily values are reported in the first three rows of Table 1a.
The results of the “typical” method used to compare the futures traded volumes with physical use are shown in rows 4 and 5, where on average this method suggests that 27 times the physical use of oil is traded on the NYMEX and 19 times for NYMEX gas. The maximum trading volumes lead to calculations of 49 times and 35 times for oil and gas, respectively.
As noted, this approach compares the average consumption for a single day to traded volumes for delivery over more than 3,100 days.
Alternatively, we may calculate the relationship between futures trading volume for the near-month (spot) contract to that of the average daily use volumes, and these figures are reported in rows 8 and 9. This approach suggests multiples of 13 for oil and 9 for gas for 2007. This approach shows significantly reduced multiples for both traded commodities.
Nevertheless, while this analysis has adjusted the focus to the near-month contract, where just under 50% of the daily trading activity typically occurs, this approach is still deeply flawed and produces misleading, meaningless results, because we have simply traded a comparison of one day to 3,100 days for one day versus 30 daysstill not “apples-to-apples.” This still does not reflect actual traded futures contract characteristics.
Alternative methodology
The trading activity each day for gas and oil futures contracts, as well as that for gasoline and heating oil, is for delivery over an entire month, not any one specific day. For example, near-month futures contracts traded during any trading day in Mayup to the last trading day, which differs across commoditiesare for quantities of the commodity to be delivered throughout the month of June.
The last trading day for the crude oil contract is the third business day prior to the 25th calendar day of the month before the delivery month.
For natural gas, the last trading day is 3 business days before the first business day of the delivery month.
For gasoline and heating oil, the last trading day is the last business day of the month preceding the delivery month.
To gain meaningful insight into the relative volumes traded under futures contracts relative to actual physical requirements or consumption, the daily volumes of the commodity represented by the traded futures contracts must be divided by the number of days in the delivery month. That is, observing daily trading volume representing contracts that account for 13 times the daily usage, but for delivery into a month consisting of 30 days, actually implies trading activity that represents just 43% of the requirements for that month.
The large multiples, therefore, are an artifact of aggregating the trading volume for all contracts traded on a given day, including those for many months and years into the future. The analysis of the near-month trading activity, the month that typically carries the largest trading volume, results in much smaller multiples, but these values also fail to reflect the actual nature of the trading activity.
Sections 1b and 2b of Tables 1 and 2 report values for near-month contracts for delivery into a 30-day month. The volumes in rows 10 and 11 are derived by dividing the corresponding volumes in rows 6 and 7 by 30. It is immediately obvious that large multiples of the physical commodity usage in the US are not represented by the daily traded volumes on the futures exchange when both are put in comparable termswhen apples are being compared to apples.
Even if the highest volume trading day is evaluated for either commodity during 2007, the volumes of the underlying commodity accounted for by the traded contracts amount to 93% of the daily usage for oil and just 50% of the daily usage for gas.
The average daily futures trading activity during 2007 represented volumes of roughly 44% of actual daily usage for oil and 29% for gas. For 2008, through May 20th, the averages are 51% for oil and 38% for gas.
Assessment
These results do not support the large multiples typically claimed, but they also do not suggest that the futures trading activity represents an insignificant share of the market. To assess the significance of futures trading activity it is also useful to observe the open interest associated with the near-month contract.
The open interest on futures contracts represents the number of contracts, and therefore the volumes of the underlying commodity, that are active and still constitute obligations on the part of buyers and sellers.
According to NYMEX, “The exchange’s core energy contracts...stipulate physical delivery, although deliveries usually represent only a minuscule share of trading volumeless than 1% for energyoverall.” That a very small share of the traded volumes goes to delivery is not indicative of speculation. The majority of contracts (i.e., open interest) are held by commercial traders who are likely hedging the price risk they face on the physical units bought or sold in separate transactions.6
By itself, trading volume for futures contracts provides only a partial picture because trading volume may add to, decrease, or leave unchanged the number of open contracts. Thus, a more complete picture is gained by also examining the volumes of the commodity represented by the open interest positions in the futures market.
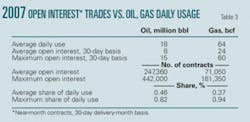
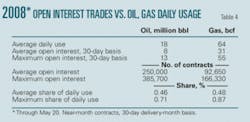
Tables 3 and 4, for 2007 and 2008, respectively, present the average and maximum daily open interest for the two commodities. When assessing the relation between near-month contract open interest and daily usage of a commodity, it is reasonable to focus on the maximum, rather than the average. This is because open interest, by definition, rises and falls during the life of the contract, beginning at zero just before the contract is listed for trading and declining back to zero at the maturity of the contract. The maximum open interest typically occurs during the near-month trading period. The open interest for the near-month contract is also typically the largest for any traded contract maturity, just as is the case for futures contract trading volume.
For oil, the maximum open interest for a near-month contract during 2007 was 442,000 contracts, and for gas it was 181,350 contracts. These maximum open interest positions represent 442 million bbl of oil and 1,814 bcf of gas. Because these volumes were for delivery over an entire month, on a 30-day month basis the oil maximum open interest represents average daily volumes of 15 million bbl, and the gas maximum open interest represents average daily volumes of 60 bcf.
These open interest positions, therefore, represent roughly 82% of the average daily usage for oil and 94% for gas. These clearly account for a substantial share of the US physical commodity market that underlies the futures market. Comparable values for 2005 show 50% for both commodities. Because open interest is the measure of market activity that represents positions held open, one interpretation of this change is that the energy sector is hedging a larger share of its exposure in 2007 and 2008 than it was in 2005.
Trading activity
Energy futures trading activity on regulated exchanges such as the NYMEX has expanded remarkably, contrary to recent claims. For example, in recent congressional testimony, Tyrone Slocum argued that “[As] a result of the Commodity Futures Modernization Act, trading in lightly regulated exchanges like NYMEX is declining as more capital flees to the completely unregulated OTC [over the counter] markets.7
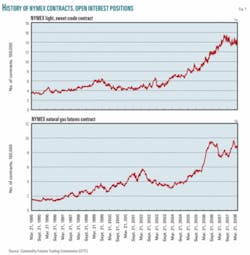
Figs. 1a and 1b show the history of NYMEX futures contract open interest for oil and gas, respectively. Since January 2001, immediately following the enactment of the Commodity Futures Modernization Act, oil open interest increased by nearly 230%, while gas open interest increased by more than 150%. Trading volumes in these energy futures markets have grown commensurately.
Placing trading volume in the context of the open interest positions may be instructive as an indicator of what may or may not be excessive trading. On a monthly basis, for 2007 the total trading volume relative to the average daily open interest for near-month (the most active contract) oil was 20 trades/month. Because typically there are about 21 trading days/month, this implies fewer than 1 trade/day relative to open interest. For gas the comparable number is 17 trades/month. The values for 2008 through May 20 are 22 and 16 trades/month, respectively.
Price discovery occurs only through transactions and trades that allow the market to incorporate new information into the price. While there is no unambiguous theoretical number of trades that could be designated as excessive, 1 trade/day does not seem excessive for the purpose of providing both price discovery and liquidity in the market.
Speculators dominating?
It frequently is said that in recent times speculators have taken over the market. They are said to dominate otherwise commercial traders in the market. This is not the place to argue the importance of the role of speculators who bring liquidity to the market and reduce the cost of risk mitigation faced by hedgers.
Without these participants it is likely that energy prices would be even higher due to higher costs associated with risk mitigation if such mitigation services were still available. However, it is worth a few words to correct the image of an overwhelming speculator class in these trading activities.
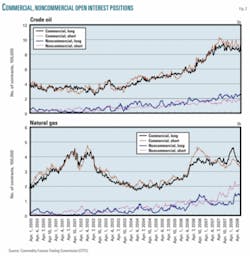
CFTC produces weekly reports on the activities of all futures exchanges under its jurisdiction, differentiated by trader type. Figs. 2a and 2b report open interest for oil and gas traded on the NYMEX for the 2000-08 (through May 20) period. The dominance in these industries is fairly clear, even while the roles of the traders have evolved.
Commercial traders are those deemed to have an interest in actually acquiring the physical commodity, while noncommercial traders do not have such an interest. Historically, commercials have been associated with hedgers, while noncommercials have been associated with speculators.
Clearly, however, commercial traders have dominated, even in the recent past associated with the run-up in prices. For 2000-08, as much as 53% of the increase in long positions is attributable to commercial traders. So, more than half of the growth on the long sidethe side typically associated with pushing prices higherhas been from commercial traders rather than noncommercials.
Moreover, of the 44% of the long positions’ growth attributable to noncommercials, 20% represents one side of an offsetting calendar spread position. This suggests that commercial participants, not the noncommercials, have been leading the markets rather than being whipsawed or manipulated.
Gas, shown in Fig. 2b, has had a different evolution. While commercials dominate the market in both long and short open interest positions, noncommercials have been responsible here for most growth in open interest in the recent past.
Nevertheless, in terms of outright long positions (those not associated with a calendar spread), the commercials lead noncommercials with 28% of the growth vs. 23%. Noncommercials, however, were responsible for 43% of the growth in long positions through spread trading. However the increased role of spread trading may be viewed both as a representation of increased risk aversion on the part of noncommercials and an enhancement of their role as liquidity providers in the market.
Typically it is found that the volatility of returns to a calendar spread position is less than that for an outright position. Therefore, increased reliance on spreads over outrights may be seen as a shift toward safer assets. The enhanced liquidity comes from the fact that a spread has two legsa long and a shortbut in different maturities. That means that a single noncommercial entering into a spread position may provide both a long and a short position to offset the hedging positions of two commercials.
So one interpretation of this phenomenon is that noncommercials are providing increased market liquidity through a shift to lower risk positions. We should not be introducing policies that will diminish this type of activity.
False claims
Claims of large multiples over actual commodity usage in trading on the energy futures markets are the result of miscalculations and incorrect analyses, which do not properly allocate the trading volumes over the delivery month. The proper allocation of futures trading volume over the delivery month demonstrates that this activity represents but a fraction of the daily US oil and gas usage, not a multiple.
The share of the average usage represented by the maximum open interest leads to the conclusion that the energy futures markets provide the basis for transparent price discovery and risk mitigation. Moreover, the number of open interest positions provides no indication of excessive trading. Commercial traders remain the dominant players in these markets, and noncommercial traders appear to be providing the liquidity that allows for both risk mitigation at relatively low cost and transparent price discovery.
No level of trading has been identified such that surpassing it implies a state of excessive trading, but the results presented herein refute claims of currently or recently excessive trading on the energy futures exchanges.
References
- Snow, Nick, “House diesel price hearing targets market speculators,” (OGJ, May 12, 2008, pp. 28-29).
- Cicio, Paul N., letter to US Senators Chambliss and Harkin regarding CFTC reauthorization legislation, Apr. 5, 2006, p. 2, The Industrial Energy Consumers of America, (www.ieca-us.org).
- New York Mercantile Exchange, 2001, “Risk management with natural gas futures and options,” p. 20, (http://www.nymex.com/broch_main.aspx).
- Cooper, Mark N., “The role of supply, demand and financial commodity markets in the natural gas price spiral,” prepared for Midwest Attorneys General Natural Gas Working Group (Illinois, Iowa, Missouri, Wisconsin), March 2006, pp. 21-22.
- New York Mercantile Exchange, 2006, “NYMEX miNY Light Sweet Crude Oil Futures,” p. 2, (http://www.nymex.com/lsco_emi_descri.aspx).
- New York Mercantile Exchange, 2006, “NYMEX Energy Complex,” p. 2, (http://www.nymex.com/broch_main.aspx).
- Slocum, Tyrone, testimony of Tyrone Slocum, director, Public Citizen’s Energy Program, before the US House of Representatives Committee on Transportation and Infrastructure, Subcommittee on Highways and Transit, May 6, 2008, p. 13.
Bibliography
Federal Energy Regulatory Commission, testimony, Mar. 16, 2006, 903rd commission meeting, pp. 33-59.
Hull, John C., Fundamentals of Futures and Options Markets, 5th edition, Prentice Hall Finance, Upper Saddle River, NJ, 2005.
New York Mercantile Exchange, “A review of recent hedge fund participation in NYMEX natural gas and crude oil futures markets,” March 2005.
The author
Ronald D. Ripple ([email protected]) is associate professor in the Economics department at Macquarie University in Sydney. Prior to his current position, he served as vice-president and senior economist for Economic Insight Inc. in Portland during 1988-2002 and previously was a senior research fellow at East-West Center, serving as coordinator for the Pacific Islands Energy Project in Honolulu. Earlier in his career, he was principal economist for the McDowell Group in Juneau, Alas., and served as special assistant to the commissioner for the Alaska Department of Commerce and Economic Development and as senior economist in Alaska’s Office of Management and Budget, Division of Budget and Management, in Juneau. Ripple has held various teaching positions at University of Oregon; University of Portland; Edith Cowan University (ECU), Perth; and Chinese University of Hong Kong. He also served in the US Marine Corps. Ripple earned a BS in finance and an MA in economics from The Pennsylvania State University and a PhD in economics at University of Oregon. He has published 15 papers, reports, books, and other publications.
