Early velocity integration vital in subsurface interpretations
This is the second of two parts on the critical role of accurate seismic velocity measurements in subsurface imaging.
The next example illustrates the link between the interpretation of seismic velocity trends and geologic interpretation of subsurface depth structures.
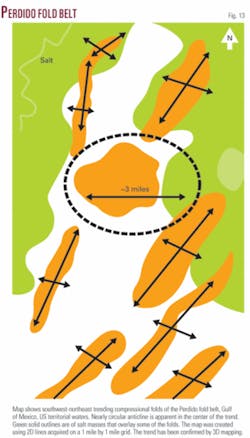
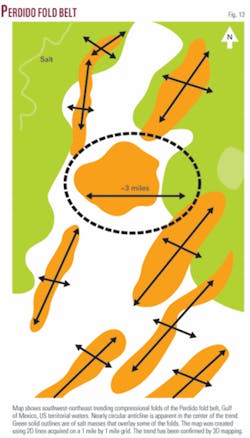
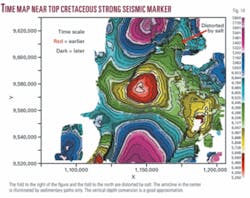
The example is taken from the Perdido fold belt in US territorial waters. A series of southwest-northeast trending compressional folds is the norm; however, a nearly circular anticline is apparent in the middle of the trend (see Figs. 13 and 14). The central circular structure has been drilled on its flank, confirming a good tie between ground or well velocities, and processing velocities.3
The area, including the circular structure, was vertically depth converted using semblance based seismic velocities with variable smoothing. As will be shown, the depth conversion and velocity diagnostics indicate that the observed circular anticline results from using a single or overly smoothed velocity that fails to account for the lateral velocity variations measured in the data. Diagnostics include 2D depth gathers of PSDM velocity models.
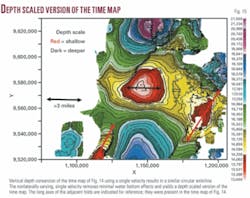
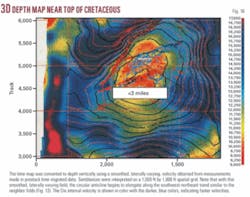
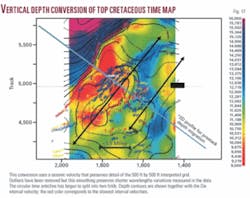
We focus on the circular anticline and show a time map (Fig. 14) followed by vertically depth converted maps using different velocities. We begin with a single function that removes water bottom variations (very minor changes, see Fig. 15) and evolve to laterally varying seismic velocities (Figs. 16 and 17). The PSTM semblance based maximum coherency seismic velocities were interpreted at 1,000 ft by 1,000 ft and 500 ft by 500 ft grids (Figs. 16 and 17).
Fig. 15 displays a depth map made using a single velocity function which removes the water bottom variations. There is negligible change to the circular shape of the anticline.
The circular anticline begins to elongate when the velocity field is allowed to vary laterally. Fig. 16 shows a vertical depth conversion of the time map using a laterally variant but smoothed velocity field from the PSTM seismic velocities interpreted at 1,000 ft by 1,000 ft spatially. The Dix interval velocities are shown in color with darker colors representing faster velocities. Note that the anticline has begun to elongate along the southwest-northeast direction, starting to resemble the neighboring folds shown in Fig. 13.
Fig. 17 displays a vertical depth conversion of the time map made with finer sampled and less smoothed PSTM semblance based velocities. The PSTM velocities were sampled at a 500 ft by 500 ft spatial grid. Note that the circular anticline has now split into two folds that trend in the same direction as the neighbor structures shown in Fig. 13. The Dix interval velocity is shown in color.
Note that the circular structure of the time map (Fig. 14) has translated into two southwest-northeast trending folds, a significant change in our view of the subsurface. One may argue that it is not plausible for the seismic velocity to change in such a manner that disguises two folds as a single circular feature and prefer greater smoothing of the seismic velocity. However, it is evident that the smoothed velocities produce a feature that is anomalous in the geologic setting. Increasing the smoothing of the measured velocity trends towards a nonlaterally varying ground velocity results in a scaled version of the time image such as shown in Fig. 15.
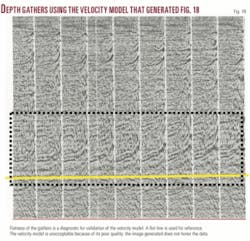
To test the hypothesis that the circular anticline is in reality two folds, we investigate a 2D prestack depth migrated line oriented across the structure, as shown by the line depicted in blue in Fig. 17. This line was processed and migrated independently of the 3D PSTM analysis. The PSDM using a smoothed velocity function is shown in Fig. 18. The interval velocities are overlaid in color. As can be seen, the coherency of the reflectors over the circular anticline is poor. Depth gathers for this image are shown in Fig. 19. Note that the gathers are not flat at the horizon of interest, confirming that inappropriate velocities were used.
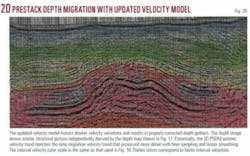
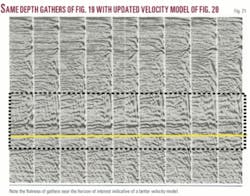
The velocities were refined using an updated velocity model that honors the shorter velocity variations present in the data. The resulting PSDM section is shown in Fig. 20, with the interval velocity overlaid using the same color scale of Fig. 18. Some depth gathers used to create Fig. 20 are shown in Fig. 21; they come from the same location as those of Fig. 19. These depth gathers demonstrate flatter events at the horizon of interest, indicating that these velocities are more appropriate. Note that the depth image shows the presence of two folds, similar to those present in the depth map of Fig. 17. The 2D seismic velocity trend is similar to the time migration velocity trendeach preserved more of the lateral variations by employing less smoothing of the velocity data. Smoothing can be reduced simply by sampling at finer increments, in both time and space. The twofold concept has not been tested as only one well has penetrated the structure.
null
Summary
The examples presented illustrate the power of integrating seismic velocity information with subsurface interpretations at an early stage.
For instance, we presented an example demonstrating a lateral variation in velocity that can be attributed to lateral thinning of sand bodies. Hence, using the velocity information as part of the interpretation process can lead to valuable insights in the lithologic setting. Lithological information may be extracted from simple, densely sampled, maximum coherency seismic velocity measurements using time migrated data, as illustrated by the subsurface channel clearly visible in a Dix interval velocity slice (Figs. 1 and 2).
With other examples, we demonstrated a good fit between proven hydrocarbon pay and slow seismic interval velocities (Figs. 5, 7, and 8), suggesting that accurate seismic velocity measurements can be used to help evaluate the potential for pay.
The velocities slow near hydrocarbon accumulations due to changes in rock properties that result from the presence of hydrocarbons, and as there is no perfect seal and the accumulation is a dynamic system over geologic time, areas near the pay zone may also display slower velocities.
In Fig. 8, the depth contours did not fit the pay zone, whereas the seismic interval slow velocity fit well. All information available, such as compaction, burial history, well information, and lithology components need to be taken into account when using velocities to identify hydrocarbon bearing targets, as all slow velocity zones are not pay.
We demonstrated that velocity trends are not overly sensitive to acquisition geometry (Figs. 9-11), but the information available in the velocity field can be lost by oversmoothing the data set (Fig. 12). Here, oversmoothing can result simply by using too gross an interval between velocity samples, both in time and space.
As shown by the two orthogonal 3D survey velocities, the time velocities from both surveys showed similar trends, but the depth velocities used in the depth migrations for the two surveys varied. Valid information was lost in one survey’s depth velocity model due to oversmoothing and coarse sampling. Because the time and depth velocity trends complement each other, both types of velocity information should be examined to ensure that valid information is preserved when transforming between domains.
Another example from the Perdido fold belt, deepwater US Gulf of Mexico, demonstrated the variation in the structural picture when converting to depth using smooth velocities vs. finely sampled, less smoothed seismic velocities. The depth maps that incorporated finer velocity detail better fit the expected geologic structural features found in the area.
In addition to impacting the imaged structures and other attributes based directly on seismic velocities, such as seismic based pore pressure estimation, undersampling and smoothing of the seismic velocity trends can lead the interpreter to miss valuable information that should be integrated into the interpretation.
As the examples demonstrated, smoothing the velocity trends should be done with care, as oversmoothing can destroy useful information while undersmoothing can result in unwanted noise. The interpreter should provide guidance on the degree of smoothing to be used, including guidance on the sampling intervals.
We have obtained excellent results with dense sampling, and in critical areas, we recommend velocity measurements be considered at every subsurface location. Smoothing of the data should take into account geological boundaries, loss of velocity resolution with depth, the quality of the data, maximum recorded offset, etc.
In cases where salt or salt welds separate younger synclinal basins from older basins with structure, many velocity models incorrectly force the seismic velocity to be laterally invariant across the salt boundary by extrapolating the young basin’s velocity into the subsalt region. The inability to make travel time vs. angle measurements under the salt indicates that the problem needs to be addressed at the acquisition stage.
If the subsalt velocity model cannot be validated by the data, this fact should be taken into account in risking the prospect and in deciding whether to commit additional reprocessing resources testing velocity models that cannot be validated by the recorded data.
The interpreter should guide the smoothing based upon knowledge of the area and of the data.
Acknowledgments
We appreciate the support of the management of Shell Exploration & Production Co. We have benefited from discussions with present and former Shell colleagues. Although we do not all share the same position on the topics discussed, we share the same enthusiasm for seismic velocity interpretation. In this article we present our interpretation of the seismic velocity trends and recognize there are alternate views. We thank our colleagues involved in the acquisition and processing of the data. The authors are indebted to Bernard Meroney, with the firm Jones & Walker, for his suggestions and technical revisions to this paper.
References
- Dix, C.H., “Seismic velocities from surface measurements,” Geophysics, Vol. 20, No. 1, 1955, p. 68.
- Guzman, C.E., Davenport, H.A., and Wilhelm, R., “Calibration method helps in seismic velocity interpretation,” OGJ, Nov. 3, 1997, p. 44.
- Couzens, B.A., Hedlund, C.A., and Guzman, C.E., SPE 103918, First International SPE Exhibition in Mexico, Aug. 31-Sept. 2, 2006.
- Al Chalabi, M., “Velocity Determination from Seismic Reflection Data,” in “Developments in Geophysical Exploration Methods,” Vol. 1, A.A. Fitch, ed., Applied Science Publishers, 1979.
- Neidell, N.S., Beard, J.H., and Cook, E.E., “Use of seismic-derived velocities for stratigraphic exploration on land: seismic porosity and direct gas detection,” AAPG Memoir 39, 1985, pp. 49-77.
- Saunders, F.D., Burson, K.R., Branch, J.F., and Thompson, C.K., “Alabama Ferry field detectable by hydrocarbon microseepages and related alterations,” OGJ, Nov. 6, 1989, p. 53.
- “Velocity Analysis on Multichannel Seismic Data,” Bok S. Byun (ed.), Geophysics reprint series No. 12, 1990.
The authors
Randall J. Miller joined Shell in 1973. His assignments have included acquisition, processing, and interpretation in exploration and development. His interest in the interpretation of seismic velocities goes back to the mid-1980s when he developed code used to interpret velocity data in the Gulf of Mexico. He has served as an advisor for velocity interpreters working in Shell International. He has an MS in physics from Louisiana Tech.
Md. Seruddin Salleh joined Brunei Shell Petroleum (BSP) in1992. At BSP, Seruddin worked as a seismic processor in the Lateral Prediction and Special Studies Group and as a seismic interpreter in exploration teams for Brunei’s Offshore East and Offshore West Assets. He worked as a seismic interpreter in the West Area Team in SEPCo, Gulf of Mexico, where he transferred in 2001. He is back with BSP where he uses seismic velocity measurement techniques he helped to develop while at SEPCo. He is a graduate of Lancaster University and has an MSc in petroleum geosciences from the University of Brunei Darussalam.
Stephen Levy has worked for Shell as a geophysicist since 1997. He has been involved in acquisition, processing, and interpretation of 2D and 3D seismic data. His interests include the application of velocity measurements in pore-pressure, lithology-fluid predictions, geologic interpretation, and imaging. He has a BS in geology and an MS in geophysics, both from the University of New Orleans, and an MBA from Tulane University.
Carlos E. Guzman ([email protected]) retired from Shell in 2007 after 30 years of service. His experience as a Shell geophysicist included assignments in seismic acquisition, processing, and interpretation in the Gulf Coast and Gulf of Mexico. His interests include integrating seismic velocity measurements and nonseismic methods into subsurface interpretation. He has a BS in physics from the University of New Orleans and an MS in physics from Purdue University.
