Method is alternative to soil gas for detecting seepage anomalies
Through the years, many geochemical methods have been developed for the detection of near surface hydrocarbon seepage anomalies. The methods most often used require the capture and analysis of gas phase hydrocarbons. This has proven to be difficult and expensive, requiring the use of special drilling rigs and sample containers.
Other methods, usually termed as indirect, have the ability to detect hydrocarbons but are less frequently used due to the incorrect assumption they do not directly detect seepage anomalies.
Methods are now available that directly detect hydrocarbons but do not require gas capture or special sampling tools.
GC detection
Near surface geochemical exploration is the application of measurements of alteration products in soils, bottom sediments, or the water column, to detect and delineate hydrocarbons seeping from an oil and gas reservoir. Surface geochemical techniques are dependent upon some degree of leakage from a subsubsurface oil and gas reservoir.
Devolatilization and thermal degradation of oils produce a continual leakage of light hydrocarbon components from the reservoir. All viable methods of surface geochemistry depend on various mechanisms of hydrocarbon migration from the reservoir, with a primary vertical vector with no lateral dispersion.1
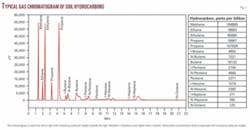
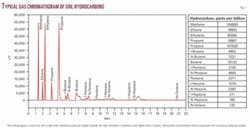
Gas chromatography, which is the primary method of soil gas analysis, is an instrumental method for the separation and identification of chemical compounds. A sample is introduced into a heated injector, carried through a separating column by an inert gas, and is detected as a series of peaks on an output device as the gas components leave the column. Each component of the gas mixture reaches the detector at a different time and produces a signal at a characteristic retention time. The area under the peak is related to the concentration of that component in the sample (Fig. 1).
UV alternative
Ultraviolet-Visible light spectroscopy offers an alternative to gas chromatograpy.
A UV-Vis spectrophotometer measures the intensity of light passing through a sample and compares it to the intensity of the light before it passed through the sample. The ratio of the before and after measurements is called transmittance and is usually expressed as a percentage (%T). Absorbance, A, is based on the transmittance using the relationship A = log(%T).
Samples for UV-Vis spectroscopy are most often liquids placed in a transparent cell known as a cuvette. Cuvettes are typically rectangular in shape, commonly with an internal width of 1 cm (Fig. 2).
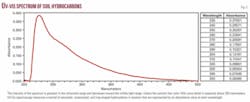
UV-Vis spectroscopy measures hydrocarbons that are soluble in water without the need to measure associated gases. Rather than measure hydrocarbon gas in parts per million (ppm) or parts per billion (ppb), UV-Vis spectroscopy measures the soluble hydrocarbon concentration in absorbance units.
Absorbance is directly proportional to the path length (cell width) and the concentration of the absorbing chemical species. The resulting peak height, or intensity, is analogous to concentration. Also, different molecules absorb radiation of different wavelengths.
An absorption spectrum will show a number of absorption bands corresponding to structural groups within the molecule. Instead of measuring light hydrocarbon gases such as methane, ethane, and propane, UV-Vis spectroscopy measures a myriad of saturated, unsaturated, and ring-shaped hydrocarbons in solution, which are represented by an absorbance value at each wavelength. When mapped, the absorbance value, which represents hydrocarbon concentration, reveals reservoir seepage anomalies at the earth’s surface.
The electrons responsible for absorption of ultraviolet and visible radiation by organic molecules are of two types: 1) those that participate directly in bond formation and are associated with more than one atom and 2) nonbonding or unshared outer electrons that are largely localized around atoms of oxygen, the halogens, sulfur, and nitrogen.5
The wavelength at which an organic molecule absorbs energy depends upon how tightly its various electrons are bound. The shared electrons in single bonds, such as carbon-carbon or carbon-hydrogen, are firmly held and their excitation requires more energy, which is found in the wavelengths less than 180 nm.
Certain nonbonding electrons such as the unshared electrons in sulfur, bromine, and iodine are less energetic than the shared electrons of a saturated bond. Organic molecules containing these elements exhibit useful peaks in the UV region. Electrons making up double and triple bonds in organic molecules are relatively easily excited by radiation so species containing unsaturated bonds generally exhibit useful absorption peaks.3 5
Use in exploration
UV-Vis spectroscopy is well suited as an oil and gas exploration tool due to its ability to provide a large amount of data relating to the complex chemistry of the milieu being investigated, specifically the near surface soils.
Vertically seeping hydrocarbons react with soil organic matter (SOM) which alters the SOM within a seep relative to the background SOM. Various biological processes help integrate free reservoir related hydrocarbons into the SOM. Condensation and addition chemical reactions provide the pathways.
Any of the soil hydrocarbons can be altered, with the primary ones being humic acids, fulvic acids, carbohydrates, and proteins. X-ray analysis, electron microscopy, and viscosity measurements of fulvic acids indicate a relatively open, flexible structure perforated by voids of varying dimensions. These voids can trap or fix organic and inorganic compounds that fit into the voids, provided the charges are complimentary.4
Many of the phenomena measured in near surface soils to detect seepage anomalies are regulated by the various components of humic and fulvic acids. These include the movement of halogens, fragmentation and integration of aliphatic and aromatic hydrocarbons, pH buffering, oxidation-reduction reactions, cation exchange capacity, carbonate deposition, and the presence and growth of soil flora and fauna.6
One favorable aspect of the UV-Vis hydrocarbon analysis is that soil samples are acquired from the very near surface with a small shovel or garden trowel. This eliminates the need for portable drilling equipment or gathering samples at depth. It also allows for proper sample location integration; a single sample is made up of several sample points at one location. Because the gas phase is not a requisite for analysis, sample preparation consists of air drying and sieving. This leads to better reproducibility and nominal data leveling from survey to survey.
Hydrocarbons are often used to characterize seepage anomalies and the reservoirs associated with them. This is accomplished using ratios of the various hydrocarbon homologs. There is potential for hydrocarbon characterization with UV-Vis hydrocarbon analysis. Because the absorbance numbers at each wavelength indicate hydrocarbons then the ratios of the wavelengths may indicate various hydrocarbon characteristics.
High correlations
Comparisons of UV-Vis absorbance data and conventional gas chromatography (GC) measurements yield a very high correlation.
As the concentration of the hydrocarbon gas homologs increases so does the corresponding intensity of the absorbance. Hydrocarbons analyzed by GC and UV-Vis exhibit linear relationships when compared to adjacent homologs or wavelengths respectively. Therefore, a correlation matrix is a reasonable tool for method comparisons.
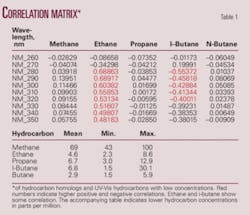
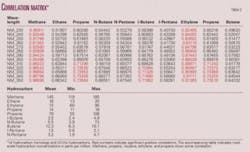
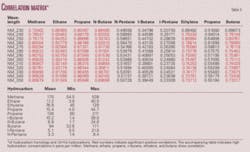
The first notable comparison establishes the concentration connection. Conventional hydrocarbon homologs and UV-Vis wavelengths correlate with concentration. High hydrocarbon sample concentrations tend to generate higher correlations while lower hydrocarbon concentrations yield correlations near zero. A comparison of the matrices shows that as concentration decreases fewer hydrocarbon homologs correlate with the UV-Vis hydrocarbons (Table 1), while the sample set with the highest concentrations has the greatest correlation with more of the hydrocarbon homologs (Table 3).
High correlation with the unsaturated hydrocarbons ethylene, propene, and butene seems logical due to the presence of double bonds, which are easily excited in the UV range. Lower correlation with the unbranched saturated hydrocarbons is expected due to the C-C and C-H bonds being excited only below 180 nm. However, vibration and rotational energy of single bonds and the presence of unshared electrons may add to transition energies causing spectral shifts to wavelengths above 180 nm (Tables 2 and 3).
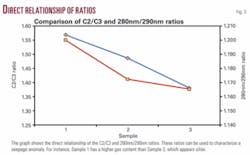
Correlation between ratios from GC hydrocarbon data and UV-Vis hydrocarbon data exhibit some meaningful correlations. The C2/C3 relationship has been used to estimate GOR and hydrocarbon maturity. Moderate to high correlations suggest that the UV-Vis hydrocarbon data might be used to estimate gas content and degree of hydrocarbon maturity. Correlations show that the C2/C3 ratio is directly proportional to the 280 nm/290 nm ratio (Tables 4 and 5 and Fig. 3).
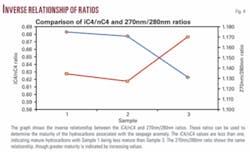
The iC4/nC4 relationship is used to determine hydrocarbon maturity.2 Values greater than unity indicate immature hydrocarbons while values less than unity are within the oil window. High inverse correlations between iC4/nC4 and the 270 nm/280 nm ratio indicate that higher UV-Vis ratios are equivalent to lower iC4/nC4 ratios (Tables 4 and 5 and Fig. 4). The matrices verify that the ratios most often represented are C2/C3 and iC4/nC4.
The final observation related to the GC and UV-Vis hydrocarbon correlations relates to regional differences. Differences in locale may yield differences in correlations due to changes in organic material, overburden thickness, type of seepage, or variations in the ecosystem.
null
null
Overall advantages
The following general rules indicate that UV-Vis hydrocarbon analysis is a viable exploration tool and is a possible alternative to gas phase samples.
- UV-Vis hydrocarbon analysis is comparable to conventional GC analysis with respect to measuring hydrocarbon concentration. Results indicate that hydrocarbon alteration of the soil organic matter is measured and not the reservoir hydrocarbons.
- Because the altered SOM is being measured, sample acquisition is from the very near surface eliminating the need for special sampling equipment. Sample preparation allows for greater reproducibility and decreases the need to level data.
- UV-Vis hydrocarbon analysis can be used to characterize alteration signatures by using ratios of the wavelengths within the UV-Vis light spectrum. Degree of correlation and the ratios used are dependent on either local or regional soil chemistry.
References
- Klusman, Ron, “Vertical Migration Model,” www.geotech.org, 2007.
- Igari, Shun-ichiro, Maekawa, T., and Suzuki, Y., “Pentane and hexane isomers in natural gases from oil and gas fields in Akitam Niigata and Hokkaido, Japan,” in “Determination factor in their isomer ratios,” Geochemical Journal, Vol. 41 (No. 1), 2007, pp. 57-63.
- Parikh, V.M., “Absorption Spectroscopy of Organic Molecules,” Addison-Wesley Publishing Co., 1974, pp. 13-45.
- Paul, E.A., and Clark, F.E., “Soil Microbiology and Biochemistry,” Academic Press Inc., 1989, pp. 108-109.
- Skoog, Douglas, and West, D., “Fundamentals of Analytical Chemistry,” 3rd Ed., Holt, Rinehart and Winston, 1976, p. 538.
- Allard, B., Boren, H., and Grimvall, A., eds., “Humic Substances in the Aquatic and Terrestrial Environment,” Lecture Notes in Earth Sciences, Springer-Verlag, 1991.
The author
Jim Fausnaugh (jmfausnaugh @geotech.org) is the owner of geotech.org in Littleton, Colo. He has nearly 30 years of experience using surface geochemical techniques and has helped develop and introduce methods that have since become standard geochemical tools. He has performed all phases of sample acquisition, analysis, and interpretation with Skyline Labs, Petro-Mineral Exploration, Petro Labs, and GRDC Inc. He has a BS in geology from Fort Lewis College.
